Powershell Tip – Afficher les propriétés ou les valeurs d’un compteur de Performances
I – La moins évidente : en utilisant directement les objets du Framework .NET :
1- Afficher le % d’utilisation du processeur sur une instance de processeur :
$ProcTime=New-Object System.Diagnostics.PerformanceCounter("Processor","% Processor Time", "0")
$ProcTime.NextValue()
2- Afficher la liste des compteurs et toutes leurs propriétés :
$proc = New-Object System.Diagnostics.PerformanceCounterCategory("Processor")
$proc.GetCounters(0)
CategoryName : Processor
CounterHelp : % Processor Time is the percentage of elapsed time that the processor spends to execute a non-Idle thread. It is calculated by measuring the percentage of time that the pro
cessor spends executing the idle thread and then subtracting that value from 100%. (Each processor has an idle thread that consumes cycles when no other threads are ready t
o run). This counter is the primary indicator of processor activity, and displays the average percentage of busy time observed during the sample interval. It should be note
d that the accounting calculation of whether the processor is idle is performed at an internal sampling interval of the system clock (10ms). On todays fast processors, % Pr
ocessor Time can therefore underestimate the processor utilization as the processor may be spending a lot of time servicing threads between the system clock sampling interv
al. Workload based timer applications are one example of applications which are more likely to be measured inaccurately as timers are signaled just after the sample is ta
ken.
CounterName : % Processor Time
etc….
3- Afficher la liste des compteurs de performance pour un objet/catégorie :
$proc.GetCounters(0) | select CounterName
CounterName
-----------
% ProcessorTime
% User Time
% Privileged Time
Interrupts/sec
% DPC Time
% Interrupt Time
DPCs Queued/sec
DPC Rate
% Idle Time
% C1 Time
% C2 Time
% C3 Time
C1 Transitions/sec
C2 Transitions/sec
C3 Transitions/sec
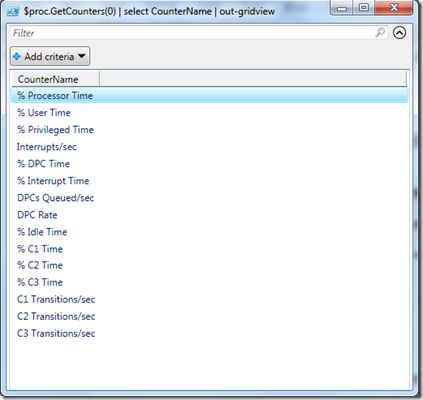
Autre tip : pour afficher les résultats dans un tableau à part sur lequel on peut faire jouer les filtres, rajouter un “pipe” avec “out-gridview” (comme on pourrait mettre “format-list” ou “fl” ou “format-table” ou “ft”)
$proc.GetCounters(0) | select CounterName | out-gridview
II – La plus simple : en utilisant directement les fonctions PowerShell
Name Category Synopsis
---- -------- --------
Get-Counter Cmdlet Gets performance counter data from local and remote computers.
Import-Counter Cmdlet Imports performance counter log files (.blg, .csv, .tsv) and creates the objects that represent each counter sample in the log.
Export-Counter Cmdlet The Export-Counter cmdlet takes PerformanceCounterSampleSet objects and exports them as counter log files.
get-counter -Counter "\Processor(*)\% Processor Time" -computername localhost
| Timestamp | CounterSamples |
| 02/09/2010 18:12:06 | \\localhost\\processor(0)\% processor time : 26,1607567053946 \\localhost\\processor(1)\% processor time : 33,8523445485826 \\localhost\\processor(_total)\% processor time : 30,0065456965152 |
