Server Manager can use up a lot of RAM in Windows Server 2012 if we query a lot of events
Under specific circumstances you might observe that the Server Manager process ServerManager.exe is using huge amounts of RAM (several GB) and depending on the available RAM eats up all the available memory.
A possible cause for this kind of behavior is the amount of events that are queried and collected by the Server Manager.
The Windows Server 2012 Server Manager is querying and collecting different events types for different time intervals from different Server.
Should you observe the described behavior (ServerManager.exe using several GB of memory), here are some details and references to look at.
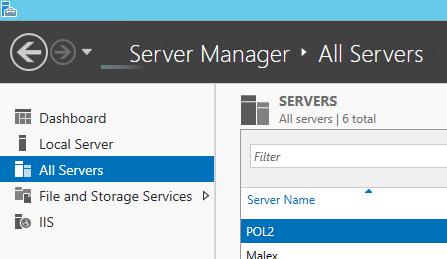
1. Isolation: From which server do we collect events?
How many/Which other server are added in the Server Manager under All Servers for monitoring?
If you remove these and restart the Server Manager, do you still see the same memory usage?
Reference: in a cluster environment all cluster nodes are added to the All Server list by default and can’t be removed.
2. Isolation: from which event-logs to we query/collect events?
Each view of the Events in the Server Manager brings events from different event-logs, depending on the specific view.
EVENTS : TASKS > Configure Data
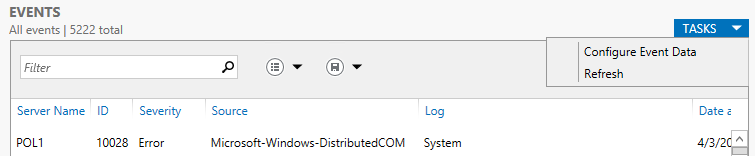
This needs to be verified for the different views. Here are few examples:
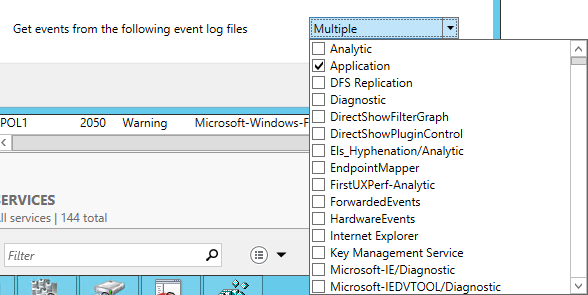
- Local Server > Events brings events from Application, Setup, System and depending on the settings the Administrator configured possibly also from other eventlogs.
- File and Storage Services > Servers:Events brings events from the FailoverClustering-Diagnsotic eventlog.
The event views in the Server Manager are defined per Server by the Administrator and per Role.
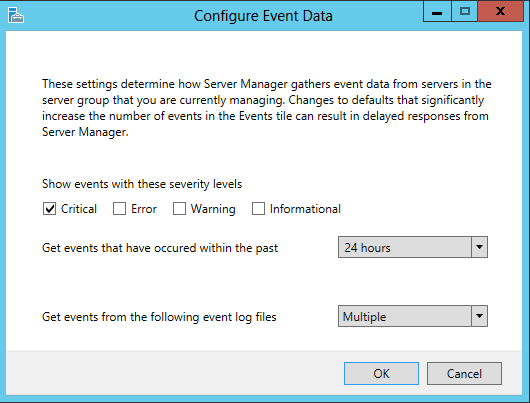
3. Isolation: What event types are collected and for what time interval?
EVENTS : TASKS > Configure Event Data
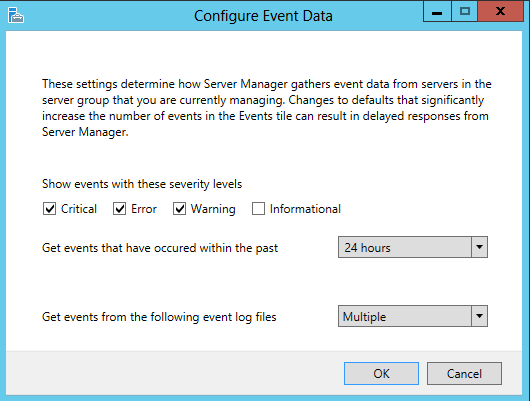
To get extreme high number of events when using this default setting, it would mean that an extreme high number of Critical, Error and Warning events have been logged during the last 24 hours.
After performing the described isolation we should have a clearer view and better knowledge of what event types, for which time interval, from which eventlog and from which server are collected.
Should one of these eventlogs have an extreme high number of being queried by the Server Manager, you might see the high memory usage.
If you did not identify the corresponding eventlog yet, you might try and proceed in a preogressive way as follows for tightening down the events view in Server Manager:
- Select only Critical per Event view (or choose a shorter time for event collection) and restart the Server Manager.
- Once the memory usage is dropping considerably, you have identified the Events view in the Server Manager. After this you can set the other previously changed event views back to the defaults and restart the Server Manager once again to confirm that it is the only Events view causing the high memory usage.
At this point it should be easy to identify and confirm the corresponding event-log from eventvwr.msc
WHAT TO DO?
We can control the amount of events queried by the Server Manager in different ways:
- Recommended: Analyze and solve the Error/Warning events from the identified event-log, so that these are not logged any more.
They will most likely reference another underlying problem - Limit the queried Events for the specific event log by Severity (Critical, Error, Warning, Informational)
- Limit the time interval for the queried Events for the specific event log
Reference
If we check the max size of the event-logs, the most event-logs are limited to 1MB, some as Application and System Eventlog to 20MB and herewith it is unlikely that the described memory usage scenario is met, as these do can not contain such an extreme high amount of events to cause several GB to be used by ServerManager.
The FailoverClustering-Diagnostic Log is though limited to 300MB and if there are extremely many errors or warnings logged here during the last 24 hours, this could cause the described behavior – this would then be the case I have been working on J
One quick step that could also lead to isolation would also be checking the event log files under C:\Windows\System32\winevt\Logs and sorting these by size. This way you would pretty fast identify the largest event-logs and then verify whether these correspond to a specific Events views in Server Manager.
Hope this helps.
Oni Sandru