System Center Operations Manager 2012 Dashboards 1
System Center Operations Manager 2012 has some exciting features out of box like Networking Monitoring, Application monitoring and Dashboards. We will cover Dashboards in series of two blogs. In the first blog we will talk about terminology of dashboards and create a performance widget. In the second blog, we will create state and alert widgets. I will be using my OM 2012 Beta edition for these blogs.
Data warehouse which was an optional component in SCOM 2007 R2 is now mandatory in OM 2012. And the main reason for this change is dashboards
While designing dashboards, we define two things:-
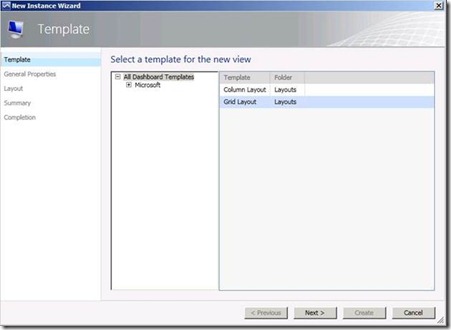
1) Templates: We have two types of templates, Column layout and Grid Layouts. We specify number of cells after we select any template. These layouts specify arrangement of cells that actually host content.
2) Widgets: Once layout is created, we add widgets in the layout. In OM 2012 beta edition, we have three types of Widgets namely Alert, Performance and State. While creating widget, we define criteria to collect data from database.
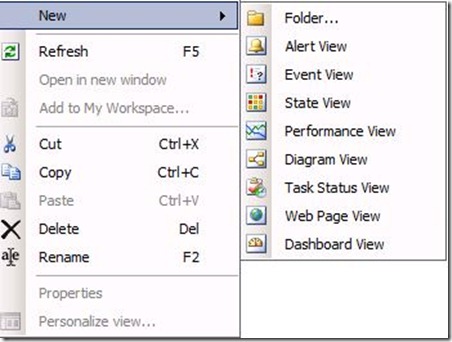
Now, we will start to create a dashboard. We will be doing this from Operations Console.
We have to choose one layout out of the two available templates. We will select Grid layout and name the dashboard.
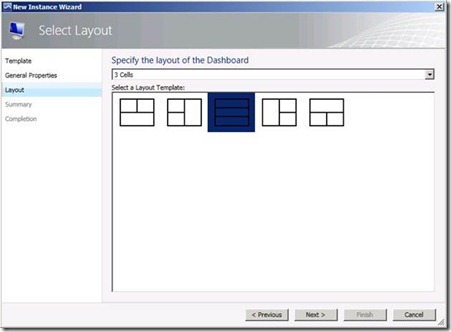
Next, we define number of cells and we choose one of the layouts.
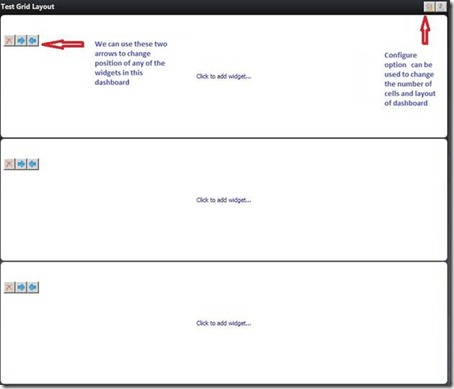
Once the wizard is completed, you can click on Configure to change the number of cells and layout of dashboard. Also you can interchange the positions of all the widgets by using the two arrows.
Adding widgets to dashboards: You can click on “Click to Add widget” and it will start the wizard of creating widgets. In OM 2012 Beta edition we have alert, state and performance widgets.
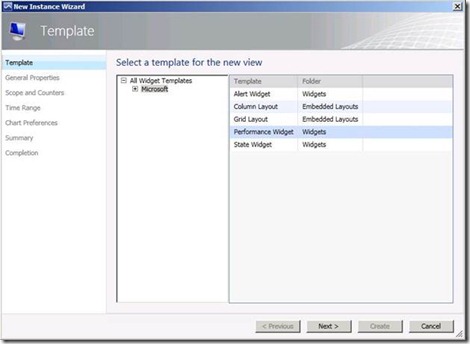
We will start by creating a Performance widget.
We will name the widget as “SQL Performance counter”, and will use this to view performance of SQL computers.
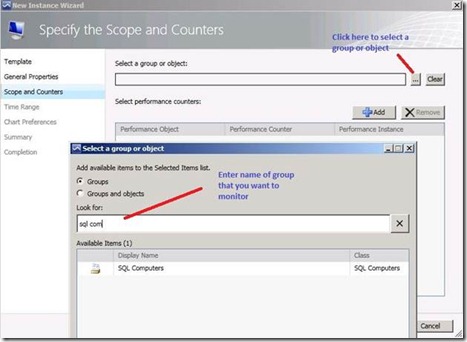
On “Specify the Scope and Counters”, select a group.
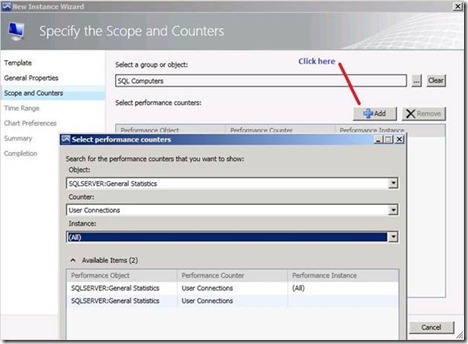
We select group of SQL computers. Next we will select performance counters. We will define object, counter and instance.
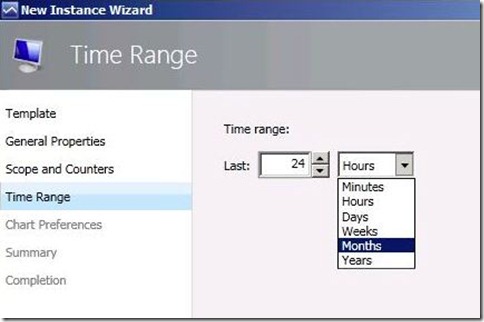
Next step is to define Time Range.
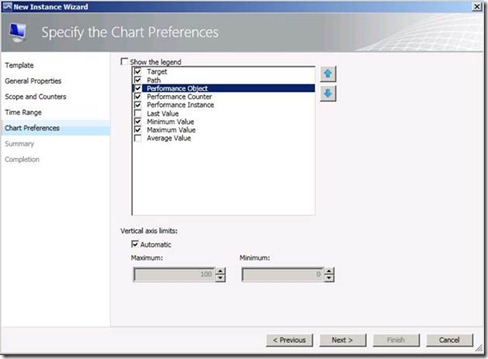
Next step is to configure the way; you would like chart and legend to display.
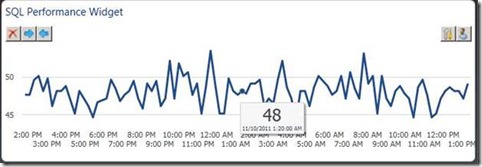
Finally we get our SQL Performance Widget. You can click on Configure to change scope, counters, time range, chart preferences. Also you can click on Personalize to change chart and legend to display.
You can also hover anywhere on graph to see the exact value.
In the part 2 of the series, we will create alert and state widgets.
Stay Tuned!!
