System Center Operations Manager 2012 Dashboards part 2
In part 1 of this series, we discussed about terminology used in dashboards and created a performance widget. In this part 2, we will create state and alert widgets. In the end we will have our Grid Layout ready with all the three widgets. We will also touch on integration of dashboards with SharePoint.
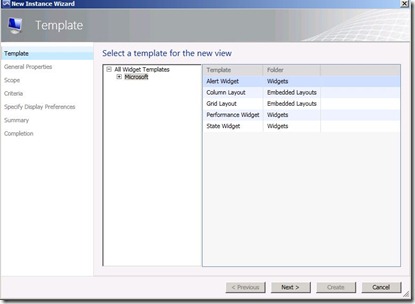
So let’s start with Alert widget. Once again we will select the Alert Widget template.
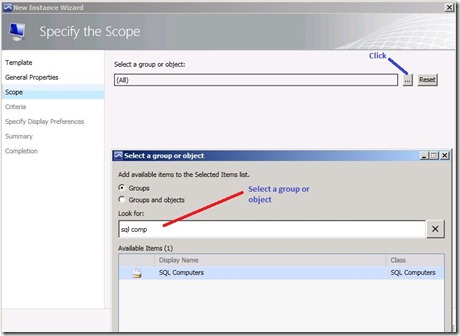
Next step is to define the scope. We have two options here, using Groups now that helps to view alerts for all objects within the selected group. Using second option Group and Objects allows targeting a certain object within a group or class. We will select SQL computers group in our case.
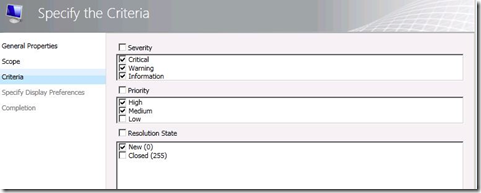
Next step is to define Criteria. We can specify Severity, Priority and Resolution State.
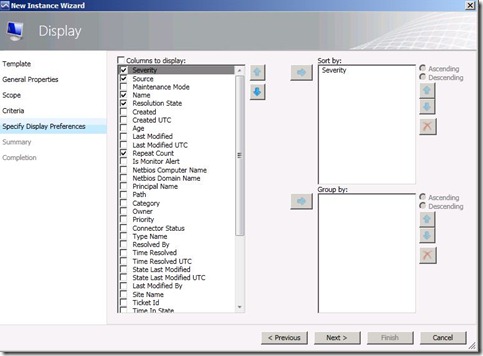
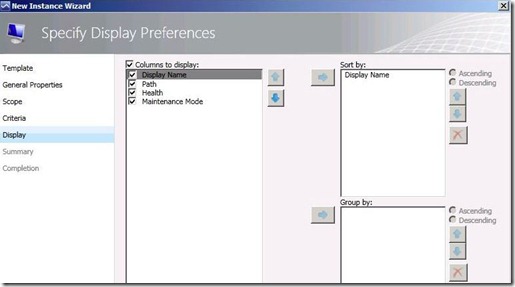
Last step is to select the columns to display, and we also have option to Sort and group the results. I will select Repeat Count as one of the columns As I am excited to see this ![]()
In part 1 of this series, we discuss using Configure and Personalize option in performance widget. Those two options will work for State and Alert widget as well.
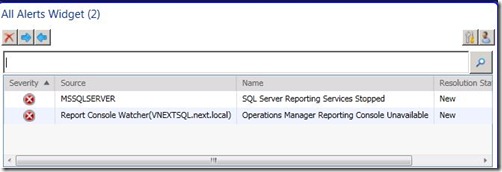
Finally we have our Alert widget ready. I stopped SQLRS to get some events in my widget ![]()
Third and last widget available in OM2012 is State Widget. We will create one now:
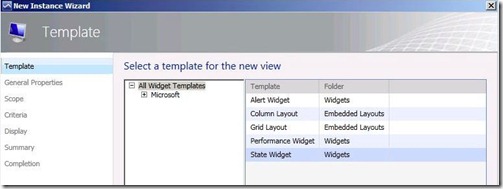
So we will select the State Widget template.
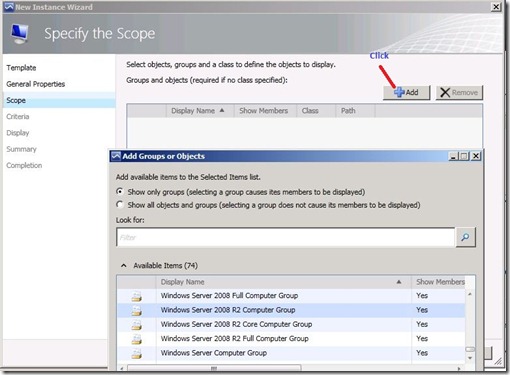
We will name this template as “All Servers State dashboard”. Next we will specify the scope, and we have the option to select only groups or all objects and groups. We will use Windows Server 2008 R2 Computer Group.
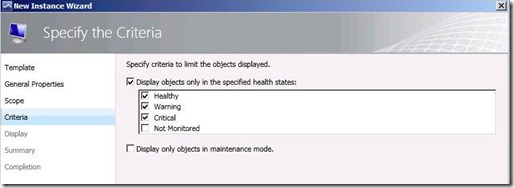
Next we specify the Criteria. We can choose objects from healthy, warning, critical and not monitored state.
Lastly we specify columns to display and we have option to Sort and Group the results.
With this our State Widget is ready.
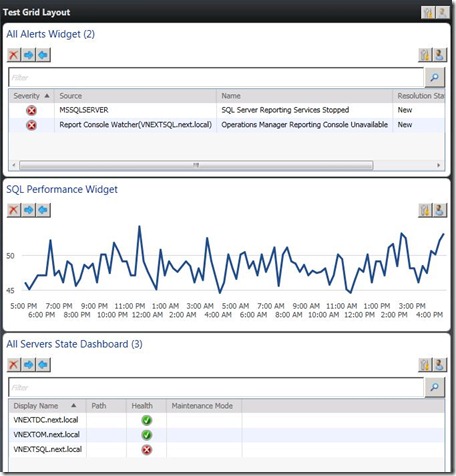
Final Dashboard Screen
We are all set now; Next screen capture has our Dashboard Grid layout ready with State, Performance and Alert widgets.
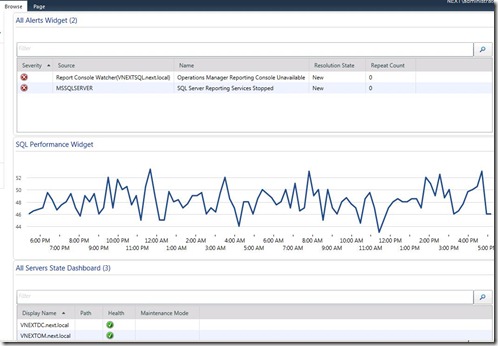
This Dashboard can be viewed in Web console also.
We can integrate these dashboards in SharePoint as well. This basically requires few steps:
· Deploying the Web Part
· Configuring the Web Part to Connect to a Web Console
· Adding the Web Part to a Page
You can find the detailed procedure in this article.
I integrated my dashboards in SharePoint and below is how it will look.
I hope this series was helpful.
Thanks for reading!
