Debugging with symbols: A field perspective
Published: December 3, 2014
Updated: December 3, 2014
Part 1: Getting Started with Debugging Symbols
Hey Folks. Platform PFEs Robert Smith and Dan Cuomo here to give you an overview on debugging with “symbols.” Now if you’re thinking to yourself, “I have no use for an ancient Egyptian writing form” or even “I’m pretty sure that cornfield thing was a hoax” then this article is for you.
In this series of posts, we’ll give you an overview of what debugging symbols are, why you need them, and how to get them. We’ll cover how to use symbols with the Debugging Tools for Windows, as well as other tools such as Windows Performance Analyzer (WPA) and the SysInternals suite. If you operate within the challenging confines of an isolated/disconnected (AKA air-gap) network, we’ll show you how to setup your own symbol resources in that environment. In addition, we’ll give you some tips to managing your symbols and also provide some troubleshooting advice for common issues you might run into.
In this first post, we’ll cover what symbols are and why they’re pertinent to you and provide an example to get you started. We would like to mention first that there is an existing article on this topic that is also a great reference:
Dump Analysis in a Disconnected Environment
We will add some information and a few tips and tricks along the way.
What are symbols and why do I need them?
The typical field scenario for symbols occurs during the analysis of crash-dumps copied from other workstations. While loading crash-dumps, the debugger will parse the “loaded module list” of the process or dump file. Without symbols, the debugger might have incomplete or inaccurate information. Here is an example from the WinDbg debugging tool showing a call stack before symbols are loaded.
Before symbols have loaded:
0:000> kf Memory Child-SP RetAddr Call Site 00000000`0027fc18 00000000`77999e9e user32!SfmDxSetSwapChainStats+0x1a 8 00000000`0027fc20 00000000`ffab1064 user32!GetMessageW+0x2a 30 00000000`0027fc50 00000000`ffab133c notepad+0x1064 80 00000000`0027fcd0 00000000`77875a4d notepad+0x133c c0 00000000`0027fd90 00000000`77aaba01 kernel32!BaseThreadInitThunk+0xd 30 00000000`0027fdc0 00000000`00000000 ntdll!RtlUserThreadStart+0x21 |
In the absence of a correct symbol for a given module, the debugger will still try to locate and display the parent function for a given call-stack, such as the one above. If you are debugging on the same machine the dump originated from, the debugger will attempt to utilize the same named module (file) from your local file system to assist in call-stack display. The problem comes when you debug from a different platform, as is the case here. The dump above was taken from a Windows 7 system, and is being analyzed on a Windows 8 system. There are modules with the same name, but different versions. Therefore, you cannot trust the output you see, even if it looks valid.
We can fix our symbols path(s) by typing “.sympath <path>” in the debugger. You can follow that by .reload and the debugger will try again to retrieve and load the correct debugging symbols:
0:000> kf Memory Child-SP RetAddr Call Site 00000000`0017f7e8 00000000`776f9e9e user32!ZwUserGetMessage+0xa 8 00000000`0017f7f0 00000000`ffc21064 user32!GetMessageW+0x34 30 00000000`0017f820 00000000`ffc2133c notepad!WinMain+0x182 80 00000000`0017f8a0 00000000`777f5a4d notepad!DisplayNonGenuineDlgWorker+0x2da c0 00000000`0017f960 00000000`7792ba01 kernel32!BaseThreadInitThunk+0xd 30 00000000`0017f990 00000000`00000000 ntdll!RtlUserThreadStart+0x1d |
Notice the function calls highlighted. The top-most in particular, is now the correct function.
Debugging symbols provide “symbolic” information about software, such as:
- Function names and the addresses of their entry points
- Variable definitions (global and local)
- Frame pointer omission (FPO) records
- Source code filename and line-number
Though there are different types of symbols, .PDB is a very common type and the type currently available for debugging Windows.
During compilation of “retail” code, the symbolic information about code can be separated from the modules, and a “program database” (PDB) is created as a result. The PDB files are matched to the original binary via a GUID, placed in .DLLs, .EXEs, and the .PDB files. Matching the proper symbol to the associated binary is vital for accurate output from the various tools that utilize debugging symbols for analysis. Here is an example from the WinDbg debugging tool showing a call stack after symbols have loaded.
General Symbol Location
This is a high level overview of how the debugging engine (Dbghelp.dll), locates and make symbols available to the debugging tools:
- Set up “symbol path” based on whether or not a path is currently defined. If no path is defined, symbols are searched for in a pre-defined list of well-known symbol locations.
- Determine GUID of given module
- As a given call-stack is parsed, search for symbols matching modules referenced in stack.
- Search local paths first. If no local matching symbol located:
- Connect to symbol server, if available, send request to server
- If a match is found, download and load the symbol
- If a local cache is defined, add that symbol to the local cache, so subsequent symbols requests can be satisfied locally instead of over a network
- If no matching symbol can be found, display an error and help text
Using the Microsoft Public Symbol Server
Microsoft provides public access to a symbol server that contains symbols for Windows operating systems and some other components such as the .Net Framework. This catalog of symbols is not guaranteed to be complete, but it is extensive and is almost always up to date.
If you have access to the Internet during debugging, you can configure the debugger (as you’ll see in the next section) to download symbols as needed during a debugging session, rather than downloading symbol files separately before a debugging session. The symbols are downloaded to a directory location that you can specify and loaded by the debugger locally.
The URL for the Microsoft symbol store is https://msdl.microsoft.com/download/symbols.
Getting Started: Debugging a Local Process
WinDbg.exe is the name of the executable that starts the GUI based debugger from the Debugging Tools for Windows package.
| NOTES |
|
| After you’ve installed the Debugging Tools for Windows, browse to the start location of your Debugging Tools, which you can find in the Start Menu. | 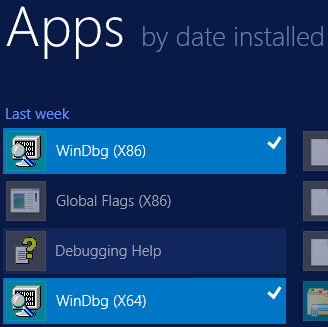 |
To get started, let’s debug a process on the local computer and add symbols to enhance analysis.
Open WinDbg.exe -> on the menu bar click "File" -> then click "Open Executable" > browse to:
%windir%\System32\net.exe
At the prompt, type .sympath srv* to tell the debugger to use the default symbol server path and retrieve symbols from the default symbol store; a structured folder path of symbols.
As you can see in the highlighted section above, the default path includes the Microsoft Public Symbol Server covered in the previous section
Now type .reload
Lastly type x net!
Symbols for the critical modules will be download to the local symbol cache as you’ll see in the next section. You’ll also find a pingme.txt file in that same location. This file is auto-generated and indicates that the location is a symbol store, even if the SRV* prefix is not provided. On our test systems, the default cache locations were:
- Windows 8 - \ProgramData\dbg\sym
- Server 2012 - \Program Files (x86)\Windows Kits\8.1\Debuggers\x64\sym
Caching symbols
As symbols are resolved by the debugging tools engine, they are cached either temporarily, or long-term. The behavior is determined by the syntax of the symbol path.
The following example shows how to set a symbol path, using what is referred to as a “downstream store. ” The debugging engine copies the symbol into a subfolder in the “downstream store” after retrieving that file from the symbol server.
In subsequent analyses, the symbol in the “downstream store” will be utilized first removing the need to browse the remote store. In the example below, the Microsoft Public Symbol server will be used to find symbols if an appropriate symbol cannot be found in C:\DownStreamStore. If found in the Microsoft Public Symbol Server, the symbol will be cached in the C:\DownstreamStore for future use.
NOTE : Substitute your downstream store path for c:\DownstreamStore:
srv*c:\DownstreamStore*https://msdl.microsoft.com/download/symbols
In field, and especially when debugging disconnected networks, you may not have the luxury of connecting to the public symbol server to retrieve symbols on demand. Instead you can take a copy of your “downstream store” folder and subfolders to your isolated network, and use that as the basis for your own symbol server.
In this post we covered what symbols are, why they’re pertinent to you, and provided an example to get you started in the debugger. In part two we’ll cover how to setup your own symbol server including how to retrieve symbols for an offline environment and setup your symbol path.
Thanks for reading,
Robert Smith and Dan Cuomo
If you’re interested in reading the other parts of this series, please see one of the links below.
Part 1: Getting Started with Symbols
Part 2: Setting up your Symbol Server and Setting the Symbol path
Part 3: Managing your Symbols
Part 4: Using Symbols with Tools
Part 5: Troubleshooting Symbols
Complementary: Step-by-Step - Debugging Tools for Windows Installation