Debugging Silverlight with windbg (finding eaten exceptions)
 Lately lot's of people are asking me the question “Isn’t Silverlight dead?” Even with the post rumors still abound strong – likely due to the prevalence of html5 in the windows 8 demo . Today two people asked me. I tell them what I tell you – stay tuned to the 2011 Build Conference September 13th .
Today we will start where we left off in last post and we will take a quick look at exceptions... so load up windbg just like you did last week.
Note that the “4” represents the 4th thread. We switched to that thread in the last post. Here we are listing all objects of type “Exception” that exist on the heap.
0:004> !dumpheap -stat -type Exception
And that gives us the results below.
total 0 objects
Statistics:
MT Count TotalSize Class Name
0cacdb20 1 32 MS.Internal.Error+GetExceptionTextDelegate
0caa8a08 1 32 MS.Internal.Error+ClearExceptionDelegate
0ca9f974 1 32 System.EventHandler`1[[System.Windows.ApplicationUnhandledExceptionEventArgs, System.Windows]]
0c403200 1 32 System.UnhandledExceptionEventHandler
0c42d5ec 1 80 System.UnauthorizedAccessException
0c42b4ec 1 80 System.ExecutionEngineException
0c42b45c 1 80 System.StackOverflowException
0c42b414 1 80 System.OutOfMemoryException
0c422a48 1 80 System.Exception
0c421990 1 88 System.ArgumentOutOfRangeException
0c4285fc 1 92 System.IO.FileNotFoundException
792c044c 2 160 System.UriFormatException
0c42d8dc 2 160 System.Threading.ThreadAbortException
Total 15 objects
_____________________________________________________________________
Now you may recall we only threw (and caught) 3 types of Exceptions (ArgumentOutOfRangeException, FileNotFoundException, UnauthorizedAccessException) and we can see those there… but there are tons more also - so you may wonder where all of these exceptions on the heap are coming from? Some exception info is pre-loaded in the heap for certain exception types [todo: add more info here].
Now let’s take a look at the “UnauthorizedAccessException”
0:004> !dumpheap -mt 0c42d5ec
Address MT Size
09e7a798 0c42d5ec 80
total 0 objects
Statistics:
MT Count TotalSize Class Name
0c42d5ec 1 80 System.UnauthorizedAccessException
Total 1 objects
____________________________________________________
So if there are multiple instances of the same type of exception they will all be listed there and you can look at them individually. In this case there is only one, so let’s do a Print Exception (pe) on that address.
0:004> !pe 09e7a798
Exception object: 09e7a798
Exception type: System.UnauthorizedAccessException
Message: you are unauthorized to do that!
InnerException: <none>
StackTrace (generated):
SP IP Function
0342D6BC 00601F25 UNKNOWN!SLHelloWndbg.MainPage.button1_Click(System.Object, System.Windows.RoutedEventArgs)+0xd5
StackTraceString: <none>
HResult: 80070005
And that gives us the exception details and the custom message string that we are throwing in the application. So keep in mind – even though this exception was eaten (caught and handled) we can still determine what exceptions are being thrown. These have a relatively short life-span on the heap so be sure to capture your dump at the right time.
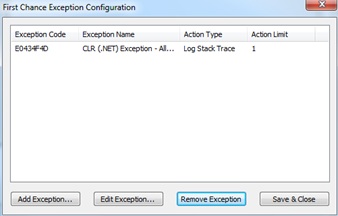
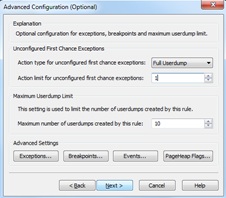
In DebugDiag (comes with Windows SDK) cancel out of the wizard. Then go to “Tools” in the toolbar, click “Add Rule” and add a first chance exception configuration (by clicking “Exceptions” in the Advanced Settings). Play around with these settings – you may want to make your action limit greater (say 50) to take the memory dump with several hidden exceptions in the heap for you to then examine. Be sure to point it at the right process (see previous post for details).

Ah Grasshopper – you are truly learning very quickly now!