Monitoring Application Gateway with Azure Log Analytics
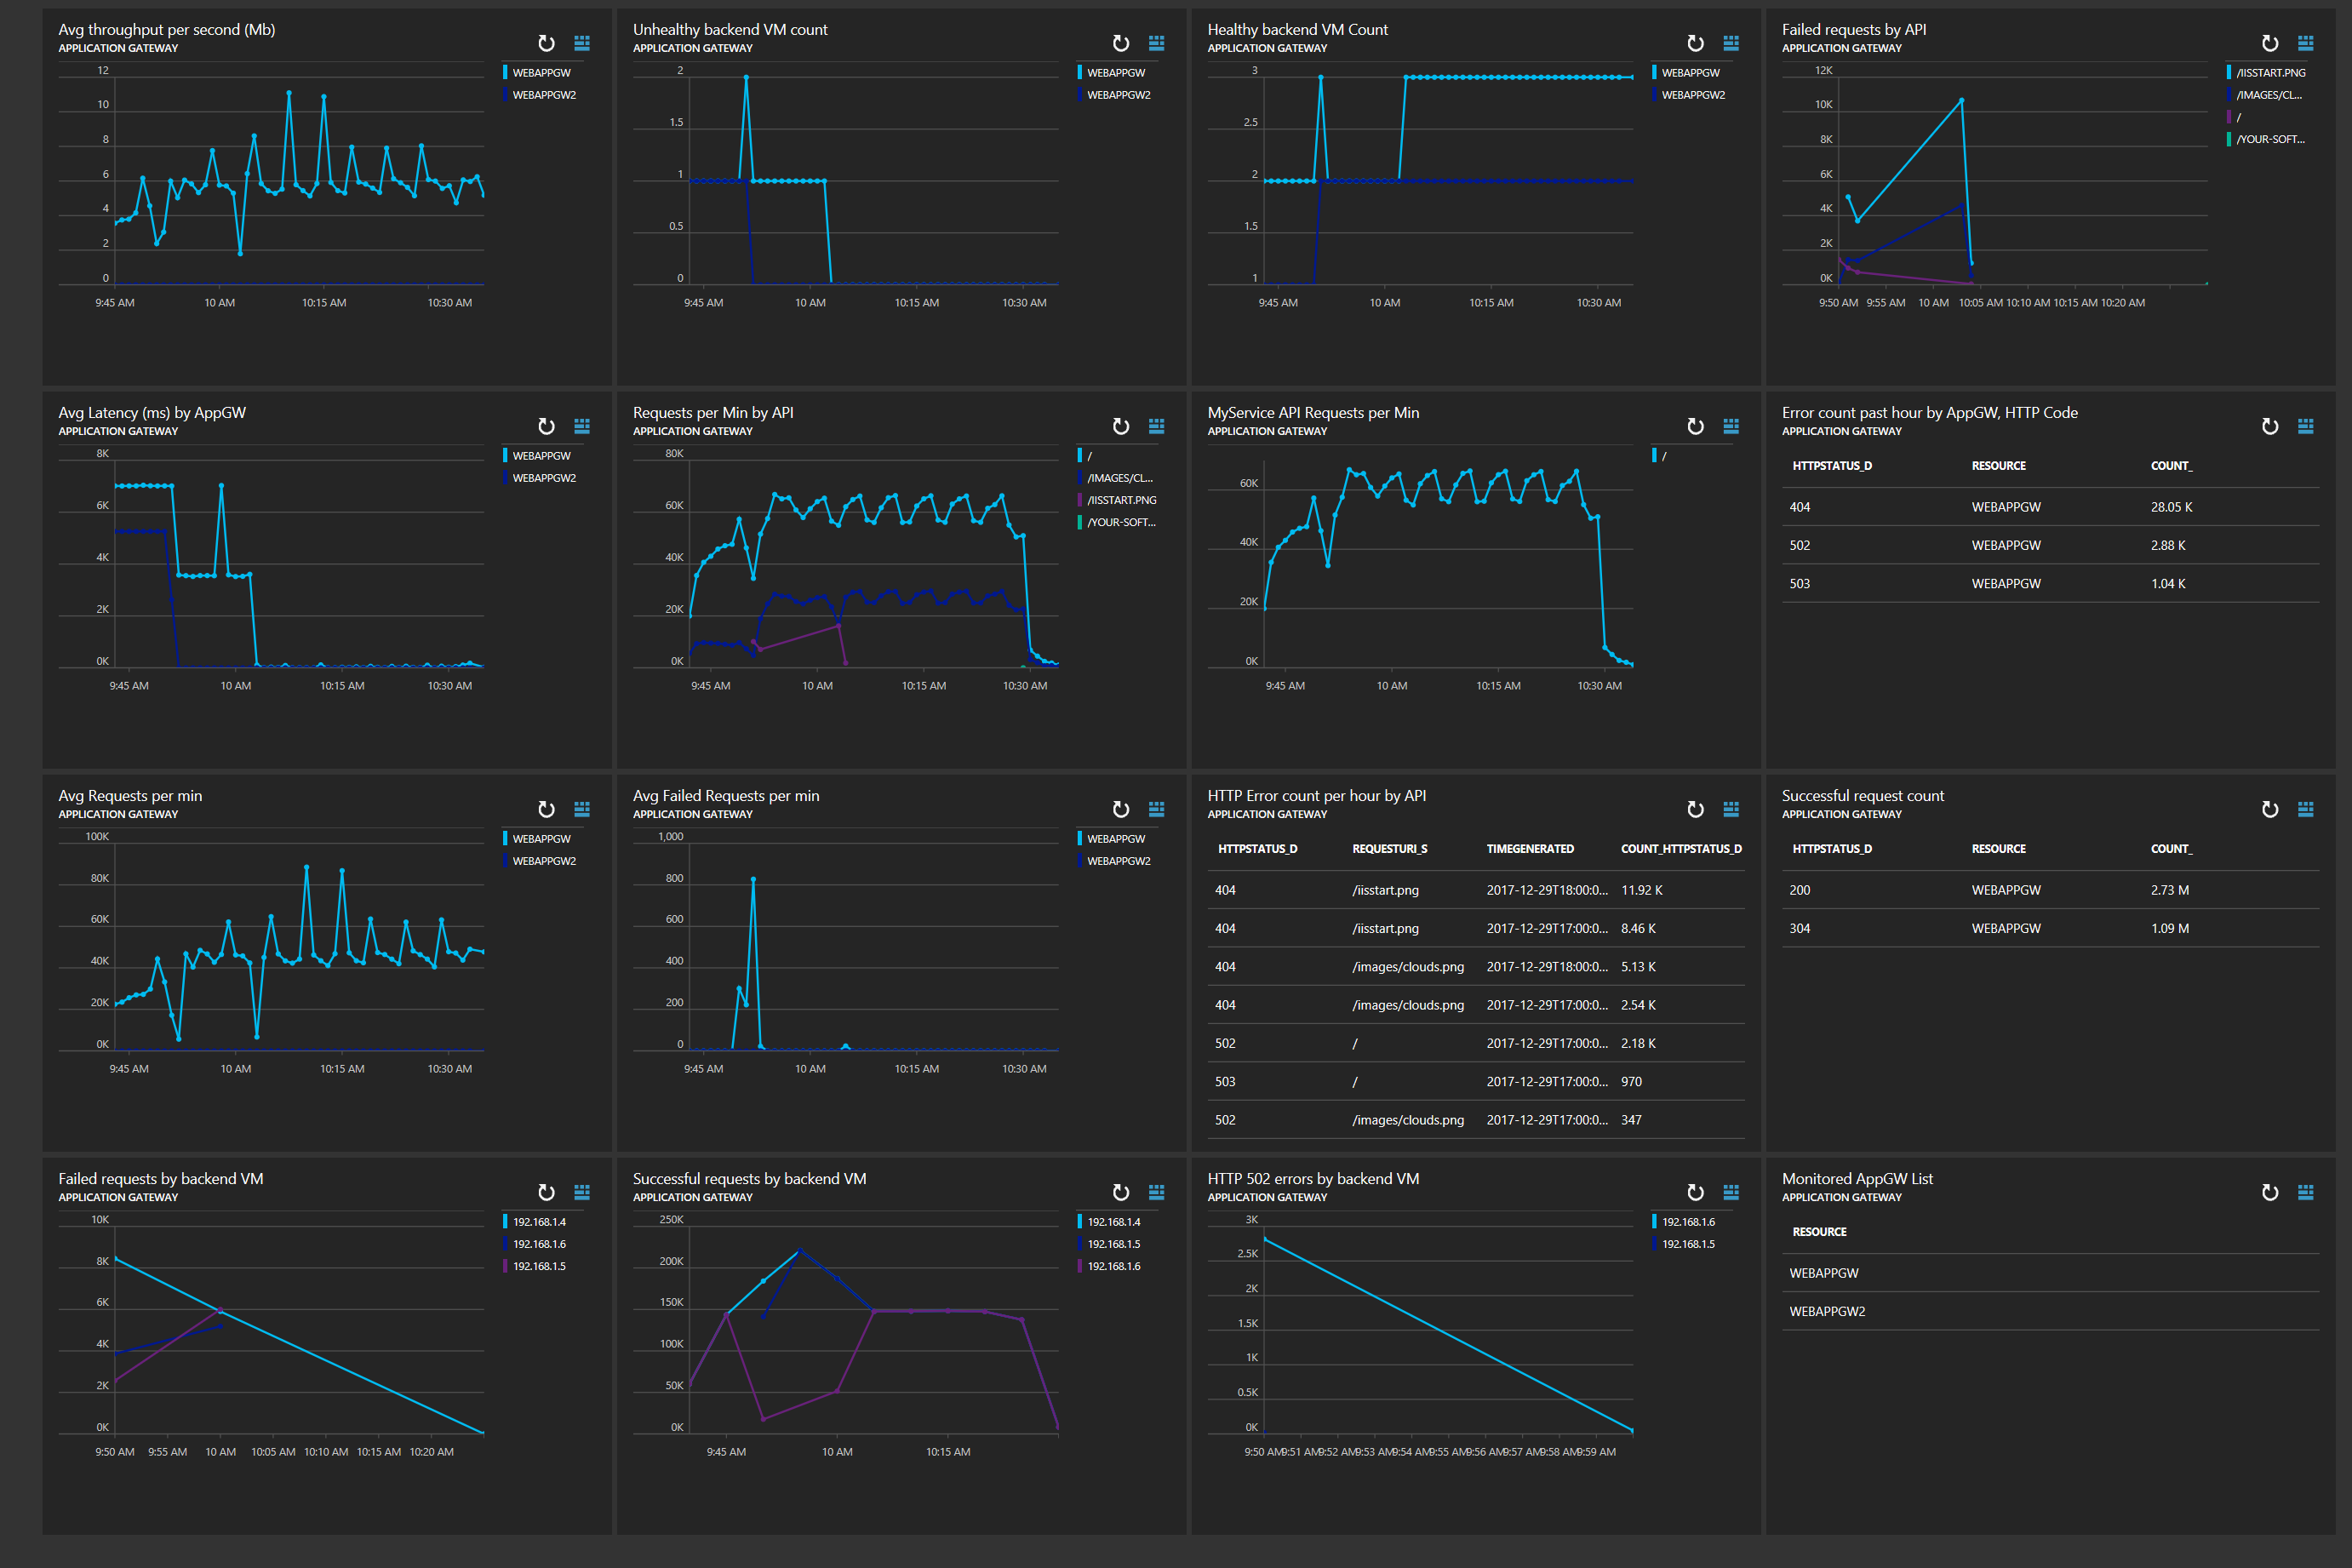
Let’s create an awesome dashboard for monitoring Application Gateway in seconds!
At the time of writing, if you look at Application Gateway in the Azure Portal, you’ll see one metric – Throughput . Although that’s useful, there’s loads more rich information exposed in the Application Gateway diagnostic logs & we can use Azure Log Analytics to monitor, alert & create some great dashboards. The purpose of this blog is to show some real-world examples you to keep your finger on the pulse of your Application Gateways.
There is an out-of-the-box solution for monitoring Application Gateway with Log Analytics, however this blog shows how to search the logs yourself, use the Log Analytics capabilities & build a customized dashboard.
Importing the dashboard
I’ve shared an ARM template for this dashboard. All you have to do is:
- Enable Diagnostic Logging for your Application Gateways (below)
- Import the ARM template from here: https://github.com/iamrobdavies/MonitoringExamples/tree/master/ApplicationGateway/Dashboard
That’s it! After importing the dashboard, you’re ready to use it from the Dashboards section of the Azure Portal.
There’s more info about ARM Templates for Dashboards here: /en-us/azure/azure-portal/azure-portal-dashboards-structure
My colleague Marco Dias has blogged an excellent example of this here: https://blogs.msdn.microsoft.com/madias/2017/09/11/azure-resource-manager-template-for-an-azure-dashboard-with-log-analytics-tiles/.
Enabling Diagnostic Logging
Application Gateway exposes 3 types of diagnostic logging, Access, Performance & Firewall, as well as Metrics. As with all our diagnostic logging, the schema for the log files are documented – Application Gateway at: /en-us/azure/application-gateway/application-gateway-diagnostics.
The great thing about using native Azure services like Application Gateway, is that you can stream the diagnostic logs directly into Azure Log Analytics. This is easily done via the UI, az CLI, PowerShell, REST or ARM template.
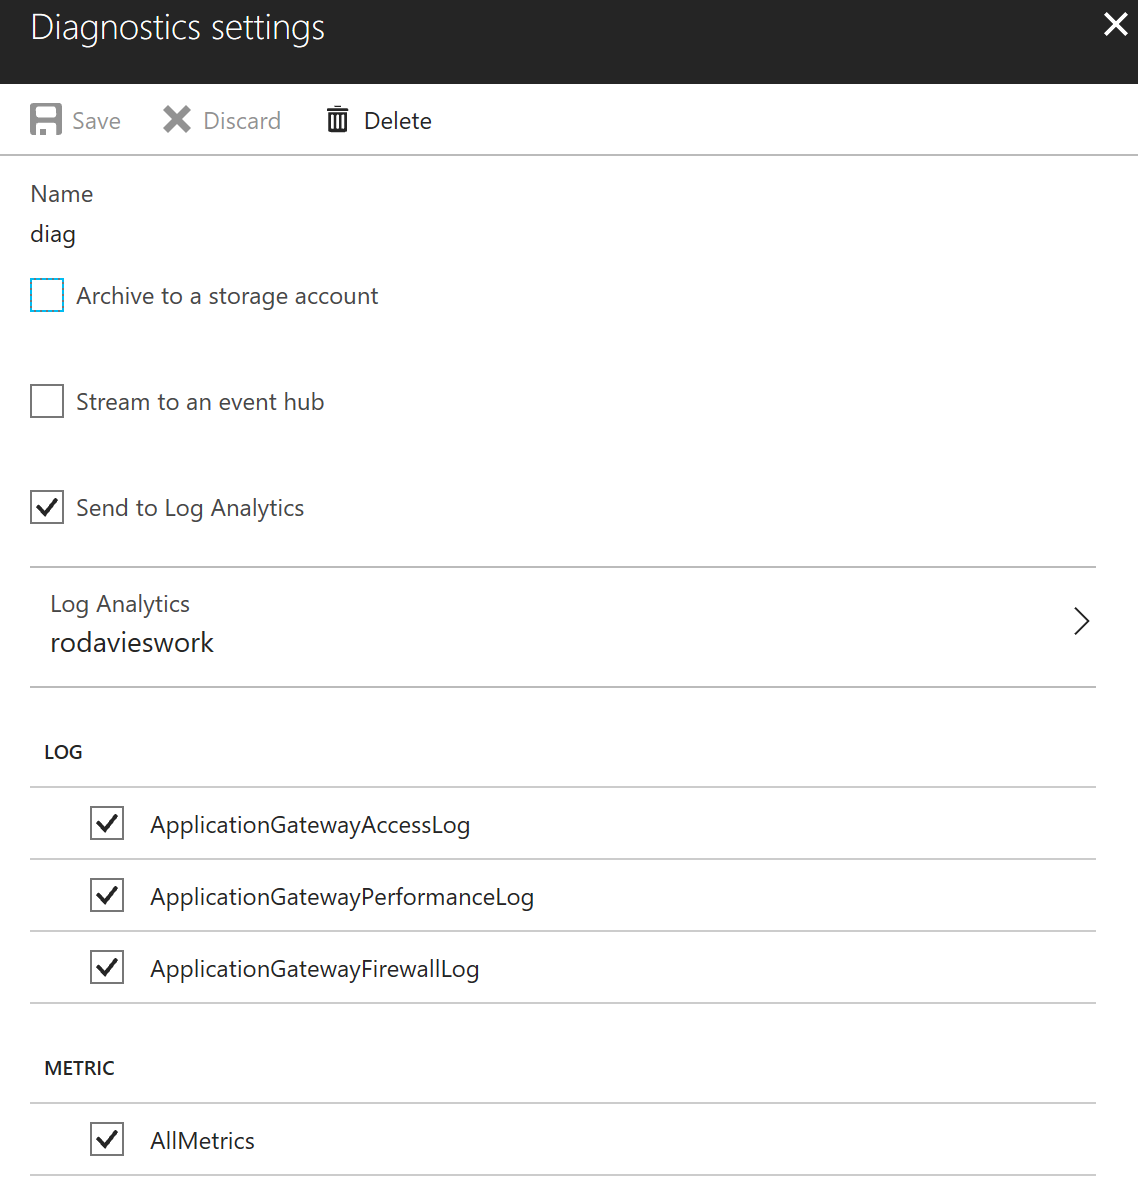
The first step is to make sure your Application Gateway Diagnostic logs are configured to Send to Log Analytics. In the Azure Portal, just navigate to the Application Gateway and click Diagnostic logs. You can enable the logs & select the Log Analytics workspace:
My preferred way is to enable diagnostic is via an ARM template – this is easier as you can switch it on at deploy time, so you don’t have to remember to do it later. I’ve posted an example Application Gateway deployment, with Diagnostic Logging to Log Analytics enabled here: https://github.com/iamrobdavies/MonitoringExamples/tree/master/ApplicationGateway/Dashboard.
Note: After enabling diagnostic logging, it may take a little while before it starts showing up in the Log Analytics workspace. After that initial wait, the logs stream across very quickly.
The assumption is that the Log Analytics workspace you are using has been upgrade to the new Log Search. I’ll be using the Analytics portal, which is only available if you have an upgraded workspace. For more information, see /en-us/azure/log-analytics/log-analytics-log-search-upgrade.
Dashboard Queries
For reference, I’m documenting each of the Log Analytics queries used for each tile in the dashboard. Remember, these are simply Log Analytics queries, using the data which is included in the Application Gateway Performance and Access Logs.
Application Gateway Logging Schema: /en-us/azure/application-gateway/application-gateway-diagnostics
Avg throughput per second (Mb)
 AzureDiagnostics
| where ResourceProvider == "MICROSOFT.NETWORK" and Category == "ApplicationGatewayPerformanceLog"
| summarize avg(throughput_d) by Resource, bin(TimeGenerated, 1m)
| extend ThroughputMb = (avg_throughput_d/1000)/1000
| project Resource, TimeGenerated, ThroughputMb
| render timechart
Unhealthy backend VM count
 AzureDiagnostics
| where ResourceProvider == "MICROSOFT.NETWORK" and Category == "ApplicationGatewayPerformanceLog"
| summarize max(unHealthyHostCount_d) by Resource, bin(TimeGenerated, 1m)
| render timechart
Healthy backend VM Count
 AzureDiagnostics
| where ResourceProvider == "MICROSOFT.NETWORK" and Category == "ApplicationGatewayPerformanceLog"
| summarize max(healthyHostCount_d) by Resource, bin(TimeGenerated, 1m)
| render timechart
Failed requests by API
 AzureDiagnostics
| where ResourceProvider == "MICROSOFT.NETWORK" and Category == "ApplicationGatewayAccessLog"
| where httpStatus_d >= 400
| summarize count() by requestUri_s, bin(TimeGenerated, 1m)
| render timechart
Avg Latency (ms) by AppGW
 AzureDiagnostics
| where ResourceProvider == "MICROSOFT.NETWORK" and Category == "ApplicationGatewayPerformanceLog"
| summarize avg(latency_d) by Resource, bin(TimeGenerated, 1m)
| render timechart
Requests per Min by API
 AzureDiagnostics
| where ResourceProvider == "MICROSOFT.NETWORK" and Category == "ApplicationGatewayAccessLog"
| summarize count() by requestUri_s, bin(TimeGenerated, 1m)
| render timechart
MyService API Requests per Min
NOTE: The intention here is that this shows the number of requests for some specific URI, maybe a critical service.
You should modify the clause where requestUri_s == “/” to the URI of the service/API you want to list.
 AzureDiagnostics
| where ResourceProvider == "MICROSOFT.NETWORK" and Category == "ApplicationGatewayAccessLog"
| where requestUri_s == "/"
| summarize count() by requestUri_s, bin(TimeGenerated, 1m)
| render timechart
Error count past hour by AppGW
 AzureDiagnostics
| where ResourceProvider == "MICROSOFT.NETWORK" and Category == "ApplicationGatewayAccessLog"
| where httpStatus_d >= 400
| summarize count() by httpStatus_d, Resource
| project httpStatus_d, Resource, count_
Avg Requests per min
 AzureDiagnostics
| where ResourceProvider == "MICROSOFT.NETWORK" and Category == "ApplicationGatewayPerformanceLog"
| summarize avg(requestCount_d) by Resource, bin(TimeGenerated, 1m)
| render timechart
Avg Failed Requests per min
 AzureDiagnostics
| where ResourceProvider == "MICROSOFT.NETWORK" and Category == "ApplicationGatewayPerformanceLog"
| summarize avg(failedRequestCount_d) by Resource, bin(TimeGenerated, 1m)
| render timechart
HTTP Error count per hour by API
 AzureDiagnostics
| where ResourceProvider == "MICROSOFT.NETWORK" and Category == "ApplicationGatewayAccessLog"
| where httpStatus_d >= 400
| summarize count(httpStatus_d) by httpStatus_d,requestUri_s, bin(TimeGenerated, 1h)
| order by count_httpStatus_d desc
| project httpStatus_d, requestUri_s, TimeGenerated, count_httpStatus_d
Successful request count
 AzureDiagnostics
| where ResourceProvider == "MICROSOFT.NETWORK" and Category == "ApplicationGatewayAccessLog"
| where httpStatus_d < 400
| summarize count() by httpStatus_d, Resource
| project httpStatus_d, Resource, count_
Failed requests by backend VM
 AzureDiagnostics
| where ResourceProvider == "MICROSOFT.NETWORK" and Category == "ApplicationGatewayAccessLog"
| where httpStatus_d >= 400
| parse requestQuery_s with * "SERVER-ROUTED=" serverRouted "&" *
| extend httpStatus = tostring(httpStatus_d)
| summarize count() by serverRouted, bin(TimeGenerated, 5m)
| render timechart
Successful requests by backend VM
 AzureDiagnostics
| where ResourceProvider == "MICROSOFT.NETWORK" and Category == "ApplicationGatewayAccessLog"
| where httpStatus_d < 400
| parse requestQuery_s with * "SERVER-ROUTED=" serverRouted "&" *
| extend httpStatus = tostring(httpStatus_d)
| summarize count() by serverRouted, bin(TimeGenerated, 5m)
| render timechart
HTTP 502 errors by backend VM
NOTE: This is a useful one to help identify where you need to the troubleshooting steps listed here: /en-us/azure/application-gateway/application-gateway-troubleshooting-502.
 AzureDiagnostics
| where ResourceProvider == "MICROSOFT.NETWORK" and Category == "ApplicationGatewayAccessLog"
| where httpStatus_d == 502
| parse requestQuery_s with * "SERVER-ROUTED=" serverRouted "&" *
| extend httpStatus = tostring(httpStatus_d)
| summarize count() by serverRouted, bin(TimeGenerated, 5m)
| render timechart
Monitored AppGW List
 AzureDiagnostics
| where ResourceProvider == "MICROSOFT.NETWORK" and Category == "ApplicationGatewayAccessLog"
| distinct Resource, ResourceGroup