CRM 2011 and SharePoint 2010 Integration - Part 2
(Post courtesy of Anand Nigam)
Hi SharePoint Folks,
This post comes after a long time after the Part 1. But as the saying goes – better late than never. Here I am back with Part 2, this time we will focus on Reporting CRM information into SharePoint Using Excel services.
- Part 1: Introduction and CRM 2011 - Document management Integration with SharePoint 2010
- Part 2: Reporting CRM data in SharePoint using Excel services (This post)
- Part 3: Publishing CRM entities in SharePoint.
- Part 4: Search CRM entities from SharePoint Enterprise Search.
The word you are thinking is “awesome”, well I know J. Ok let’s cut short the talking and make it work, get ready!
Reporting CRM data in SharePoint using Excel services
So below is what you will need,
- CRM 2011 deployment and some sample data (I populated my CRM with built in sample data).
- A SharePoint 2010 farm, with a web app created
- This post
What we will achieve by end of this post is to create an excel based report, to – Show all the account’s revenue, and have a filter on accounts based on number of employees . Our first step in the direction of SharePoint –is the SSS i.e. Secure Store Service. We will use Secure Store Service to, create an Application ID, We will use that App ID to retrieve the information from database server where the CRM 2011 is currently connected.
TASK 1
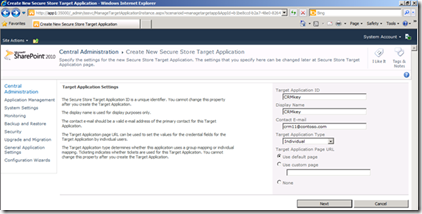
So we to SharePoint Central admin > Secure Store Service application and Create a New Application ID> and fill in the info as shown in the figure below,
- Target Application ID – CRMKey
- Display name – CRMKey
- Contact E-mail – any valid email address preferably
- Target Application Type – Keep it to Individual
Click Next,
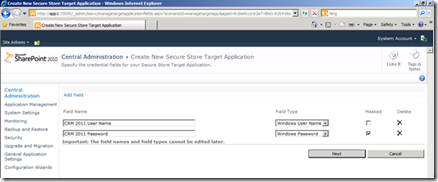
Modify the Field name to reflect appropriate application credentials, this is not a necessary step, you could leave the default names as is.
Click Next
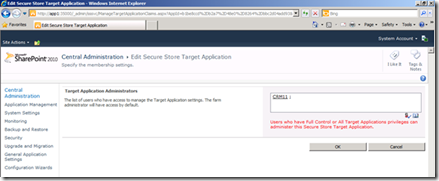
Specify who is going to manage the target application, Apart from farm admin, who by default has rights to modify the settings. For now, I have specified my CRM admin’s account – contoso\crm11.
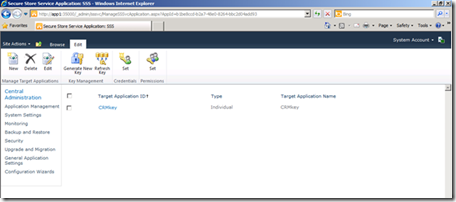
Click Ok and proceed to SSS main page, with our Application ID created.
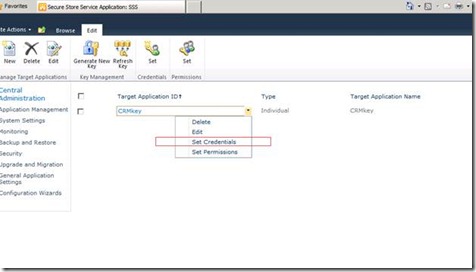
Here we just need to set the credentials once, Click on the drop down and select Set Credentials
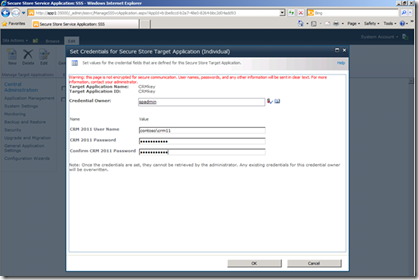
Below is what you will see, in Credentials owner specify the account that will manage this credentials – more simply put – just put the farm admin account here. What is more important here is in the username and password box, you specify the CRM 2011 account who has admin credentials, basically who can create a connection to the database Server of CRM 2011 deployment
I have specified my crm11 admin account and its password. Click Ok to Finish
We are DONE with SSS now.
TASK 2
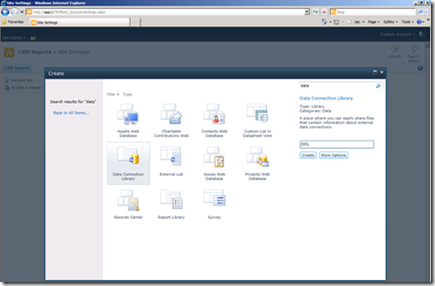
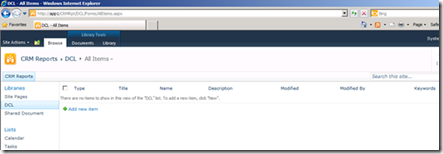
Next we will create a Data connection Library, which is a specific type of library where we will store the data connection file (.odc),
Now create a library where you want the resulting excel file to be published, this can be any normal library. I am going to use my Shared document library.
TASK 3
Now one important task, We need to configure excel service to trust the “data connection library” and the “shared documents” . Unless the trust is configured the report would not render.
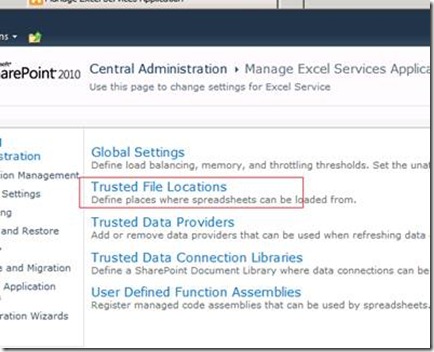
So Open Excel Service application main page > click on “Trusted File Location”
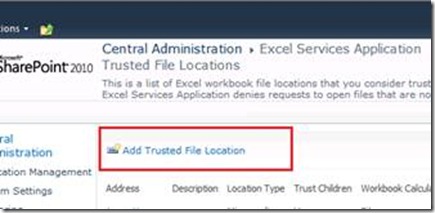
Click “Add Trusted File Location”
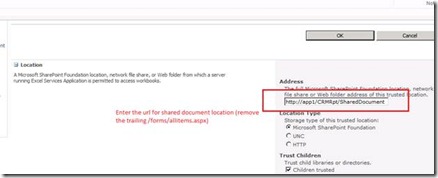
Enter the shared documents location (and of course remove the trailing /forms/allitems.aspx)
Tick mark – Children Trusted
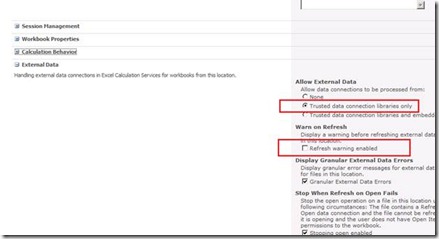
Scroll down, Under the External Data section Select Trusted data connection libraries only (this is because we will use the connection kept in SharePoint)
Uncheck Refresh warning enabled
Click on OK
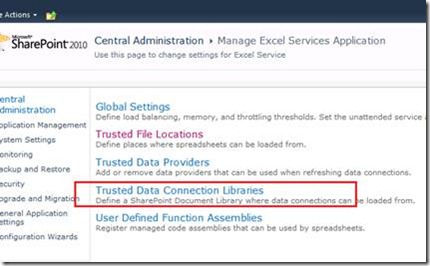
Now go back to Open Excel Service application main page> click on “Trusted Data connection Libraries”
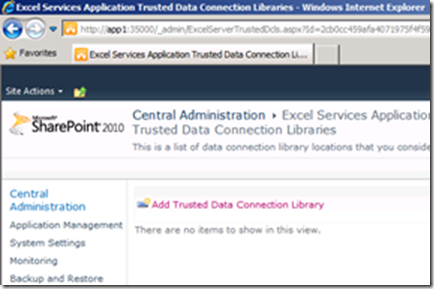
Click on Add Trusted data connection library
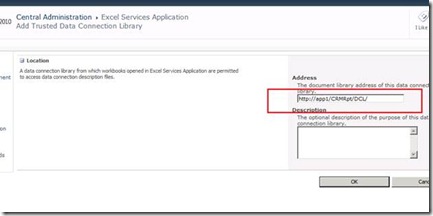
Enter the location for data connection library and click OK
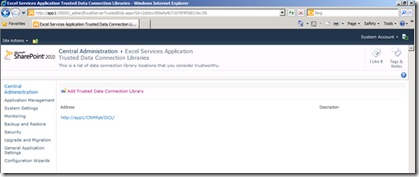
The result should like this
TASK 4
After this Next comes the task to create a connection file which will enable Excel to connect to CRM database views
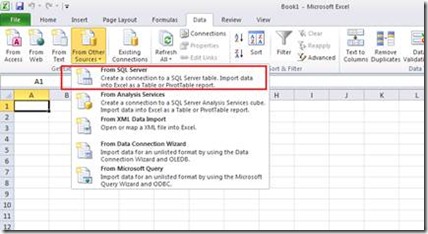
1. Open Excel > Data > From Other Sources> From SQL Server
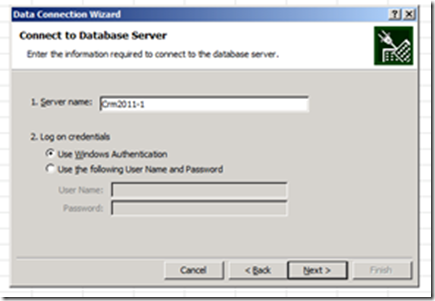
2. Specify the CRM’s SQL server name,
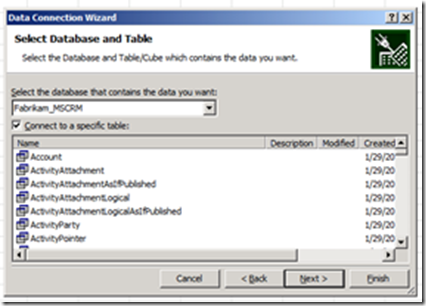
3. Specify the Organization database of the CRM, in my case its Fabrikam_MSCRM, and Select FilteredAccount
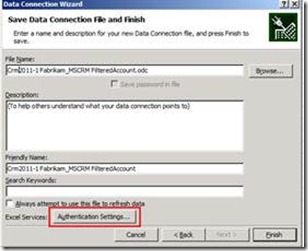
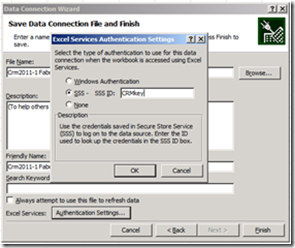
4. On the next screen, click Authentication Settings next to Excel Services, and enter the SSS Application ID we created
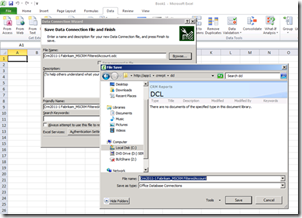
5. Click ok and come back to the wizard, Now click on Browse and save the connection file to SharePoint Data connection library
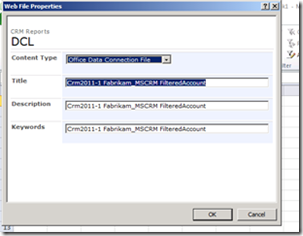
Click Finish in the wizard, after the wizard finishes just click on OK, in the property window that pops up
Then just hit cancel and exit out of Excel.
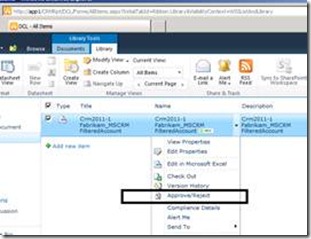
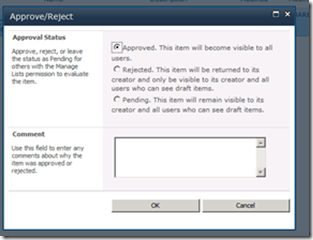
6. Now click Save, Once saved, Go to SharePoint data connection library and Approve the connection file, as shown below
TASK 5
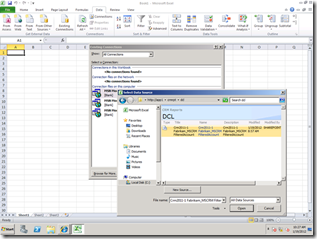
Let’s now create an Simple Excel Report. Open Excel > Data> Existing Connections> Click on Browse for More and specify the SharePoint data connection library location, and click open.
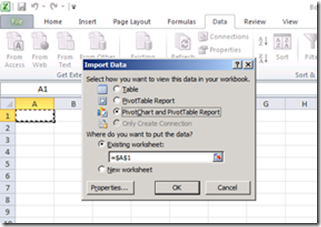
Now you will get the Import data prompt , select Pivotchart and Pivotable Report, and click Ok
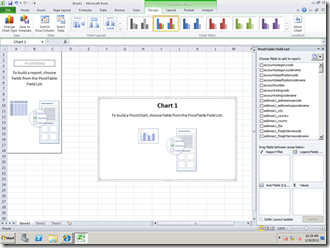
You get the Pivot chart on the Excel worksheet
Now Coming back to our objective to –“– Show all the account’s revenue, and filter to filter the accounts based on number of employees”
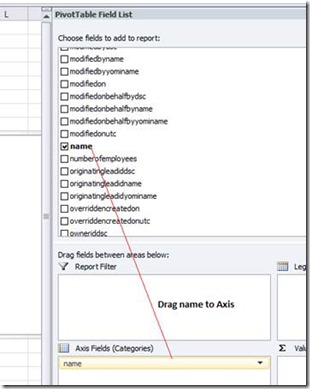
We will drag the Field “Name” to “Axis Fields (categories)” box, By the way the fields are sorted in alphabetical order, it should be easy to find fields.
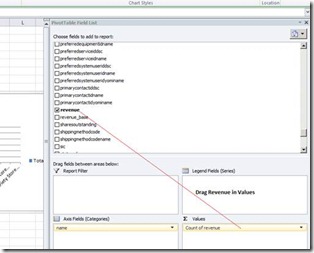
Next drag the “revenue” field to “Values” box,
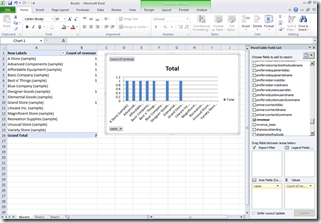
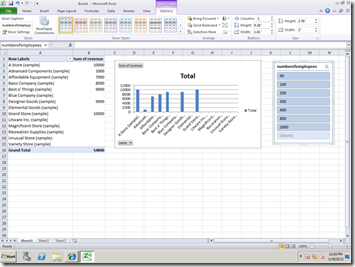
The end result is as below
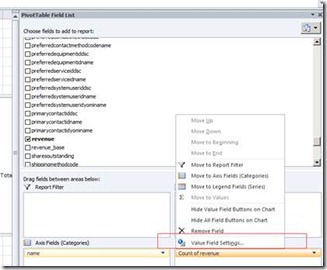
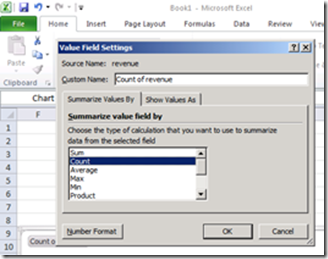
You will notice the pivot table shows the COUNT of the revenue, which is not what we want, we want to see the number, so right click on the “revenue” or “count of revenue”
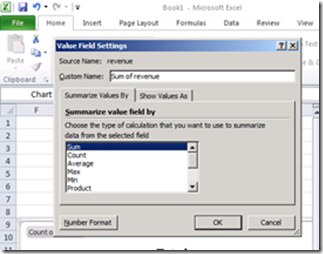
By default Count is selected, change it to Sum and click OK
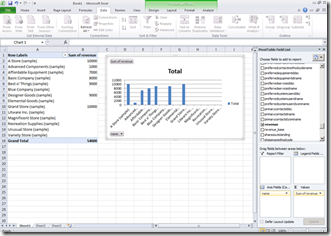
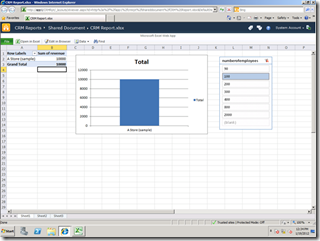
Now we see the table and the chart correctly
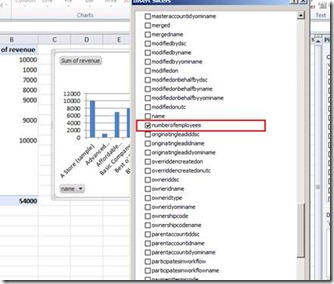
Now the next job is to Add a Slicer that will filter the chart and table based on the number of employees. Select the Chart by clicking it once and then Click Insert and select slicer
Select “numberofemployees” and click OK
You will now be able to see some meaning full report
Task 6
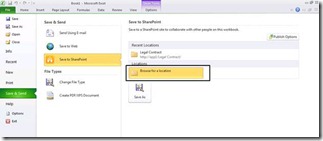
Now the real hero comes into picture, the Excel Services. Click on the file>Save & Send> Save to SharePoint > double click on “Browser for a location” and locate the SharePoint document library location where the Excel report will be saved
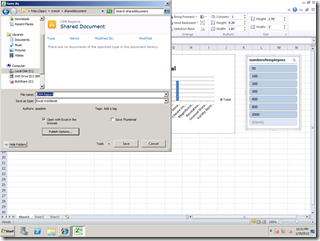
Navigate to shared document library
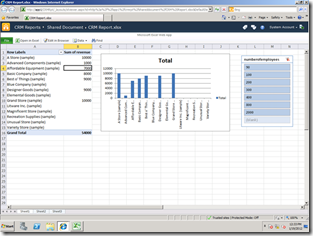
As soon as you save you see the report in the browser
Verify if its working by selecting the “number of employee” slicer
And yes it does J
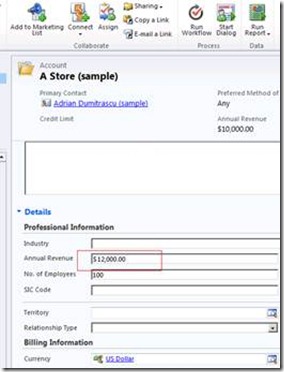
Ok what happens when the CRM data changes ? Try it – Open an CRM account and change the revenue value , I did for “A store (sample)” form 10000, to 12000.
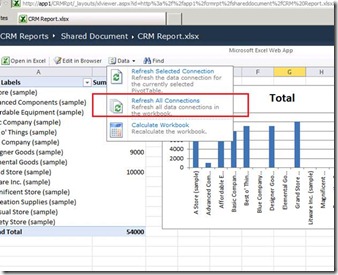
Now go back to the excel service report and click Data> refresh all connection
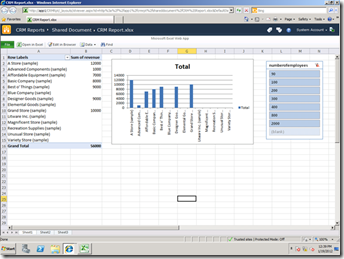
And see the smooth update of data
And this way you can hopefully build complex and more meaning ful reports and publish it in SharePoint.
Enhance this ?
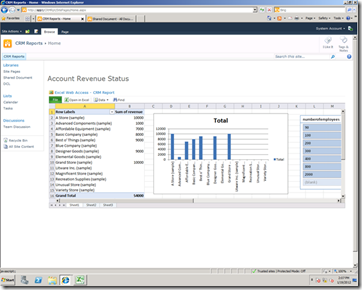
If you want to show/display the excel workbook anywhere in SharePoint, you can use the Built in “Excel Web Access web part”
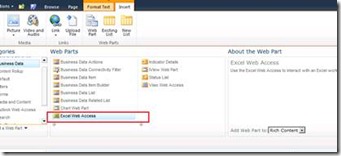
Open your SharePoint site and edit the page and add a webpart “Excel Web Access”
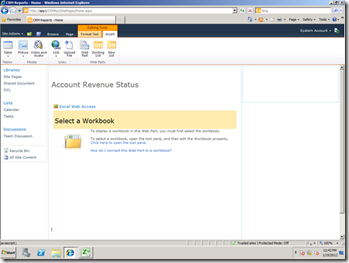
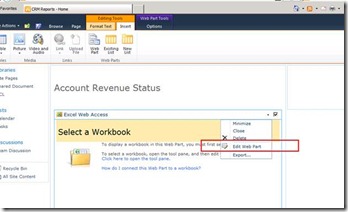
Click Add and see the web part added. Now open web part properties
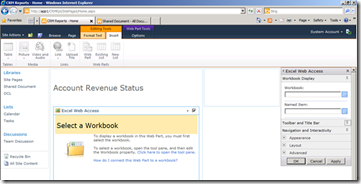
You will see the properties
In the workbook Box enter the excel work book location, in my case - \crmrpt/shareddocument/CRM report.xlsx. Click Apply.
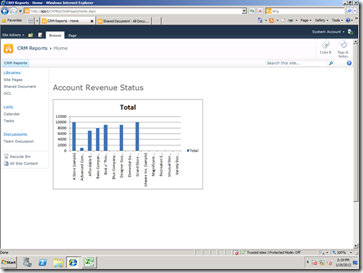
Further we can just have the chart shown in the site
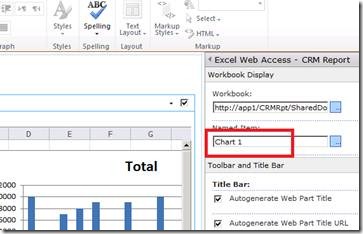
Change the web part property, Enter Named Item to Chart 1 (This is the chart object’s name), if you want to verify open excel and see the chart property
And It just shows the chart on the home page,
To get the chart name see in the Excel, click on the chart object to select it and see the name in ribbon.
Further Enhance this using Connected Web parts
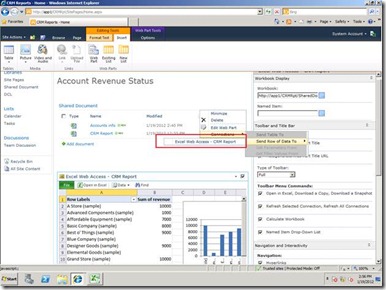
If you have several reports in the library AND you want to just have click and see behavior we can create connections between web parts to have that kind of experience. Just ensure that you have multiple reports in the library.
Edit the home page, Add the library that has Excel Reports in it AND add the Excel Web Access webpart on that same page, Configure the Excel Web access to show a report (this would be the default report that it will show). Now click on the menu of the Library >Connections>Send Row of Data To > Excel Web Access Web part.
In the following popup menu
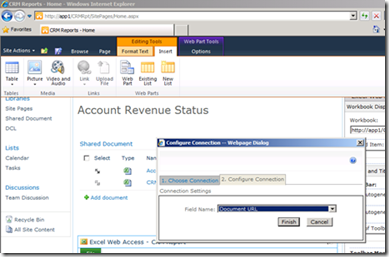
Got to Tab 2. Configure Connection> and set the Field name to Document URL> and Finish. Now save and Close the page.
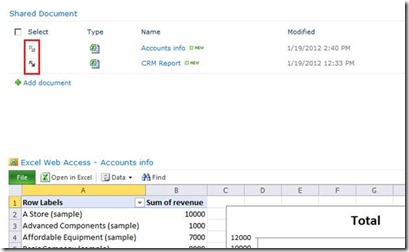
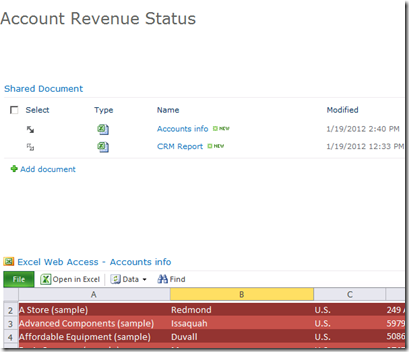
See it in action, by selecting the report
With that I will come back with the 3rd and the 4th part soon. Thanks for reading.
