Slow Performance for Reporting (Publish) Jobs
We had a scenario where five particular Project Schedules were taking 8 minutes to finish publishing to the Reporting DB, but the Draft and Published database jobs were finishing in less than a minute. All other 200 schedules in the system would publish almost instantly. What is so different between the fast and slow schedules? Why is the Reporting database publish so much slower than its cousins? Another problem, likely associated, was 30 minute response time opening 15 schedules in bulk from PWA into Project Pro. But, all other aspects the system performed very fast such as Timesheets, opening Project Center and drilling down, opening Resource Center and running availability and allocation views. This was a Shared platform with SharePoint and Livelink and which some believed to be the root cause while others believed the timesheet entry task history was root cause and that Project Server was just maxed out but not so.
The main difference between the five slow schedules and all the others is the five slow schedules were specially used to capture known ongoing operational work on an annual basis. We call these Operational Schedules. The tasks were scheduled out by 1 to 2 years with all people in the organization assigned as resources with percent units. This would allow management more accurate understanding of resource availability. An example might be to assign Joe Klein for the year at 50% to the "Maintenance work" task so he shows available the other 50% of the time for other project work. With this Operational Schedule concept in mind, the real root cause will make sense as outlined below. Also, the slowest of the five schedules was an older plan with 1.5 years of timesheet actuals. Why did this one take so much longer to publish to the Reporting DB, but was quick to save to Draft db and Published db?
To find the answers to our questions, we began with an architecture and platform review, then performed a series of project publishing tests from Project Pro in a systematic process of elimination to determine which component might be the bottleneck. We determined there was no CPU, Memory, or Network bottleneck issues on any of the servers. We copied the four Project Server databases to a virtual machine running on my laptop which uses Solid State drives. Publish time reduced from 8 to 2 minutes; problem solved! It had to be a disk issue! The Production Folks moved the Project Server database files and associated log files to faster disks and now the 15 schedules would bulk open from PWA into Project Pro in less than a minute, down from 30 minutes, and the Reporting Publish job time went down from 8 minutes to 2 minutes.
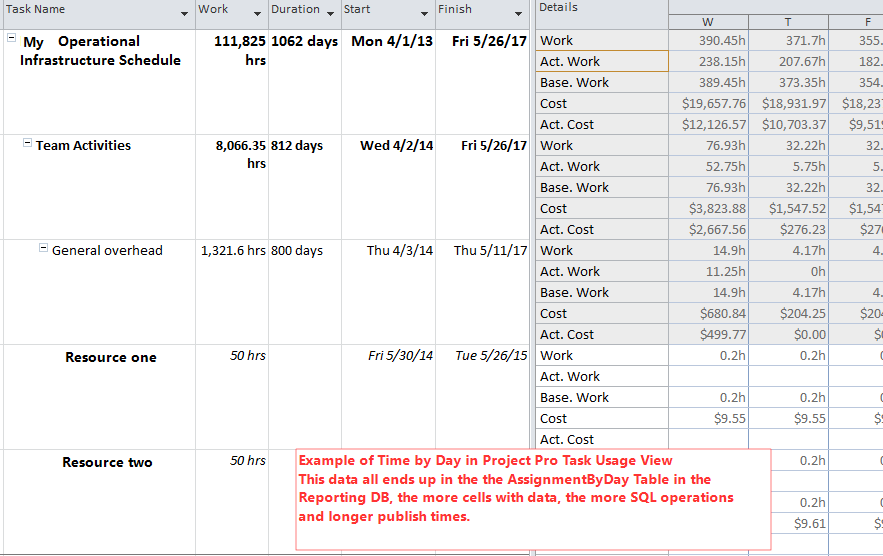
I still wanted to know why the Reporting Publish jobs took so much longer on those five schedules, so I fired up PSSDiag and SQL Nexus and found the main culprit is the TimeByDay table population in the Reporting DB. The TimeByDay tables host one record for every day per resource assignment and are used by the OLAP Cubes and custom reports to allow for reporting on Time Phased work. The Draft and Published databases manage this data differently and do not have such tables nor do they experience the performance problem. In the case of the five special schedules, the TimeByDay is greater than normal schedules because of the 1 to 2 year task spans with hundreds of assignments. This generates many, many TimeByDay rows in the table, because there is one database row per resource assignment per day for every day of the year (minus calendar exceptions). For example, a two year task with 800 assignments would be approximately 400,000 rows, to be populated to multiple tables including AssignmentByDay, TaskByDay, and Baselines, etc. This generates a ton of operations on the SQL server during Publish operations.
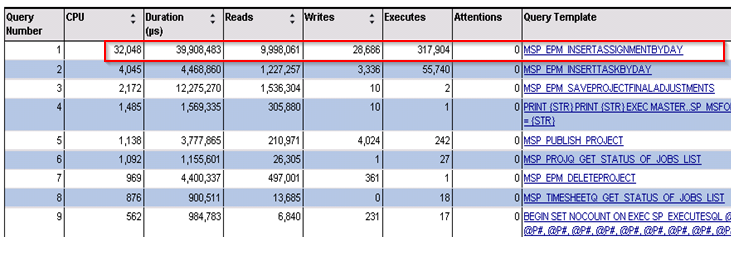
Below is a SQLNexus analysis chart of what is happening during a Reporting Publish job and you can see the load the TimeByDay updates are exhibiting on the system.
In an effort to improve the Reporting Publish performance, I tried setting Max DOP in SQL Server to various values. The best performance was with a value of 1, as per Microsoft recommendations for SharePoint. I put the SQL data files on different drives and got a bit of improvement (because of better disk I/O) and I tried with 4k and 64k Sector size in SQL Server and noted similar speeds. There did not seem to be another way to speed things up other than faster hardware, archiving projects to reduce the database size, or optimizing the schedules.
It is very interesting to note that changing all tasks to “Manually Scheduled” adds 2 minutes to the Reporting Publish times. (Why would that be? Maybe I should write another blog article on this one?) And with Manually scheduled tasks, even making a few small change to the schedule and publishing it will still apply a heavy load to the Reporting DB but for a shorter duration (about a minute less). With Auto Scheduled Tasks in same scenario, the Reporting Publish job is quick, but checking in the schedule and re-opening it, then making a small change and publishing will go back to applying heavy load on the SQL Server.
I was still determined to improve publish times down to at least one minute without faster hardware and I believe the only answer is optimizing the Schedules. I studied the worst offender, an older schedule that has been in use for two years with timesheet actuals captured for 54 resources across 44 tasks for 920 assignments. This scenario generates a ton of TimeByDay records in the database and the planned work, actual work, and cost values are all populated in the TimeByDay tables. In fact, the “MSP_EpmAssignmentByDay” table has 19 fields in it, so you can see how each row in the table will add work for the SQL Server. I wondered if we could reduce this amount by deleting out last years’ daily entries? Will this help performance? I found that yes, it does, but this may not be the answer either because, generally speaking, you should not have to delete your data in return for performance.
I also tried deleting data to see if this would improve performance, I deleted all projects except two from PWA Server Setting, but received errors in Queue deleting from the Reporting DB. I considered that maybe my problems are related to a corrupt Reporting DB? I made a new one by provisioning a dummy PWA instance (changed the extended property key to make PWA provisioning believe it is a valid db). Then to refresh the reporting db with fresh data, I just had to back up and restore the Enterprise Custom Fields using the Admin tool in Server Settings > Administrative Backup and Administrative Restore from PWA. This process completely refreshed all data including projects, resources, custom fields, tasks, assignments, and the “ByDay” work. After all this, publishing times remained the same, so the Reporting DB was not corrupt. Now once again, I tried deleting projects and was successful. The MSP_EpmAssignmentByDay table had 2 million rows when I started deleting projects. I stopped deletions and tested project publishes with 1.4M rows and found the same performance. I tested with 1M rows, found the same performance again, and I tested with 0.5M rows with no change in performance. I reindexed the Reporting DB, same speeds. Deleting project data does not seem to help.
Summary and Lessons Learned
Make sure you have enough Disk I/O available to handle the high volume of executions on the Reporting database when publishing schedules with many "time by day" values. Operational schedules should be treated as projects where there is an end date, so don’t let several years of historical work build up over time. Implement new operational schedules each fiscal or calendar year and close the old ones to get them out of the way, but do not delete them. Think about less detailed breakdown of work in the ongoing operational project plans; overhead is overhead, so you don't need many detailed task assignments. Don’t start archiving and deleting your completed projects in an effort to improve publish performance, it won’t help much in the near term, and maybe years down the road, it will make sense to archive old projects using a documented archive plan with a regular archive process frequency.
The Reporting database could be considered a non-critical database, because it can be re-built easily and therefore, could be placed on cheaper Solid State Drives. If the drive does fail you will have a reporting outage, but PWA will still operate (until the Application Pool is recycled) giving you time to replace the SSD so the risk of failure and major outage is low and could dramatically improve performance at a low cost. A note: do not refresh the Reporting database during business hours because this process is VERY disk intensive on the SQL Server.
SQL Server's Max Degree of Parallelism (MAXDOP) property with a value of 1 is recommended for optimal performance of SharePoint and is a mandatory setting for SharePoint 2013. My testing here proves MAXDOP of 1 is an optimal setting for Project Server, as well, so a single instance of SQL Server for both products might be your best choice, but make sure your disks are architected properly with plenty of disk I/O. Try to get your own set of spindles and LUNs for Project Server, because this product can make intensive use of disk I/O. Keep in mind that Project Server was designed to allow the Administrator to configure the Reporting database to a different SQL instance than the Archive, Draft, and Published databases, this could be an answer also to improve performance.