Use Performance Analysis of Logs Tool to perform A Farm Health Check
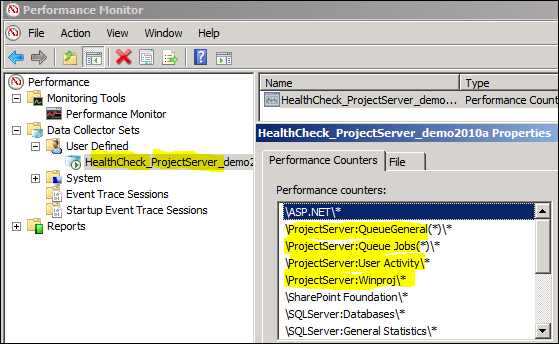
As mentioned this morning in this webcast Microsoft Project Server 2010 – Operations webcast on May 19th a great tool to analyze logs is the Performance Analysis of Logs (PAL) Tool on CodePlex. To test it out, download the 64 bit version in the newly released Project 2010 demo image (Microsoft Project Server 2010 RTM Demo Virtual Machine is Ready for Download). I created a list of performance counters listed below (in my case all roles are in one virtual machine, in a production environment you will have to adapt the counters for each server role in your farm):
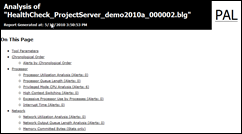
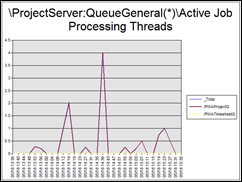
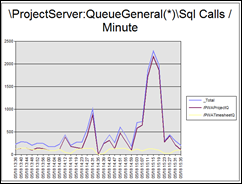
I then started the trace, played around with my demo image to generate some stress (like republish all projects with a PowerShell script!) and after two hours I used PAL to analyze the logs generated and got this very useful report (attached in this post to illustrate the analytical power of the tool, again this is just a sample):
 |
 |
 |
 |
