Custom Resource Providers in Windows Azure Pack - Debugging the Hello World sample
Today we have Torsten again as a guest blogger! In his previous post he explained us how to extend the Hello World sample to call a SMA Runbook. Now he will explain us how to debug when things don’t go as expected!
Hello readers, Torsten Kuhn again, I’m a Principal Consultant from Microsoft Consulting Services and in this post I will walk you through the different steps required to make it easier to debug the changes you made to the Hello World custom Resource Provider sample based on my last blog. While extending the Hello World Sample you’ll probably add more and more code and of course situations may occur where you have to debug the changes to understand the behavior of the code changes.
Dear readers! – You should be familiar with: Visual Studio, Internet Explorer 11 and JavaScript.
In my last blog post I extended the Hello Word custom resource provider with a new REST API that calls a SMA Runbook. Now it’s time to show you how to debug the new functionality taking as a reference this article from the Windows Azure Pack Developers Kit.
Prerequisites
- Visual Studio 2012 installed (in my case I had Update 4 applied as well).
- Windows Installer XML (WiX) toolset 3.7.1224.0 installed (direct download: https://wixtoolset.org/releases/feed/v3.7).
- A Windows Azure Pack environment on the same machine up & running.
- The Hello World Custom Resource Provider deployed as described in this blog post.
- Internet Explorer 11
This blog explains the necessary steps to debug the Hello World Sample:
Step 1 - Unprotect the Admin and Tenant site configuration.
Step 2 - Configure the admin and tenant site to development mode.
Step 3 - Client-side debugging.
Step 4 - Server-side debugging.
Step 5 - Additional information sources.
Step 1 – Unprotect the Admin and Tenant site configuration
When the WAP portal is installed the web.config files of the admin and tenant sites are encrypted by default. We can decrypt them using the WAP Configuration PowerShell. To do so from the Windows start screen navigate to the Management service program group, launch the Windows Azure Pack Configuration PowerShell and execute the following commands:
| 001 002 | Unprotect-MgmtSvcConfiguration "adminsite" Unprotect-MgmtSvcConfiguration "tenantsite" |
Step 2 – Configure the admin and tenant site to development mode
Now open the web.config file of the admin portal located in C:\inetpub\MgmtSvc-AdminSite directory (on my development machine) and change the DevelopmentMode setting from “false” to “true” as shown in the highlighted line
appSettings> <add key="webpages:Version" value="2.0.0.0" /> <add key="ClientValidationEnabled" value="true" /> <add key="UnobtrusiveJavaScriptEnabled" value="true" /> <add key="Microsoft.Azure.Portal.Configuration.PortalConfiguration.ConfigurationVersion" value="ZJ/bdRUi" /> <add key="Microsoft.Azure.Portal.Configuration.PortalConfiguration.DevelopmentMode" value="true" /> <add key="Microsoft.Azure.Portal.Configuration.PortalConfiguration.EnableExtensionTrimmingInLeftNav" value="false" /> <add key="Microsoft.Azure.Portal.Configuration.PortalConfiguration.DataSetNormalPollingIntervalInSeconds" value="60" /> |
This setting prevents the script code to be minified and so it’s more readable and easier to debug. We have to do the same configuration change in the tenant’s site web.config file located in C:\inetpub\MgmtSvc-TenantSite directory (on my development machine).
Step 3 – Client-side debugging
No we are ready for debugging the java script code using Internet Explorer 11. Launch an Internet Explorer 11 browser and navigate to the WAP Admin site and hit F12, then click on the debug toolbox icon:
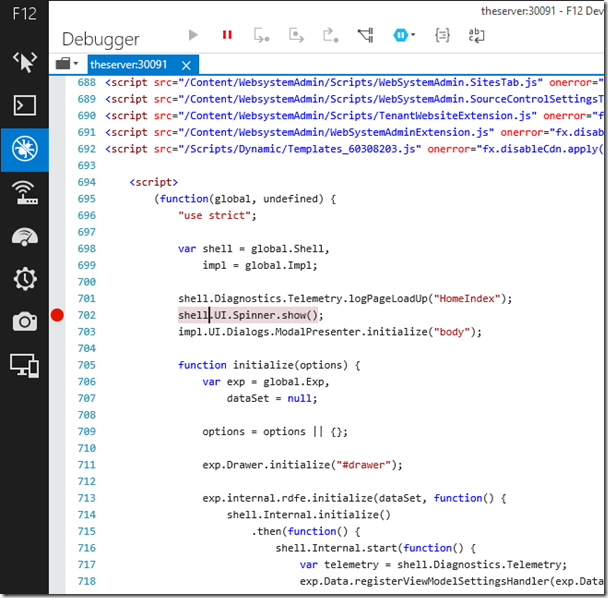
You will see the main script of the admin site. Here you can scroll down and set a breakpoint in the startup code.
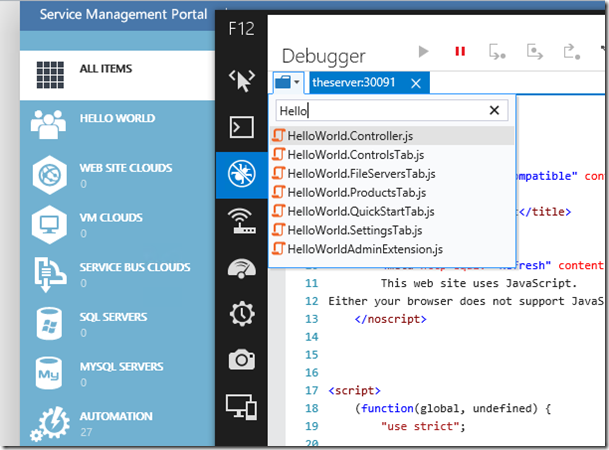
An easy way to navigate to the Hello World Script code files is to click on the open document button located on the left upper corner and begin to type Hello. All source code files with Hello in their file names will be displayed in a list:
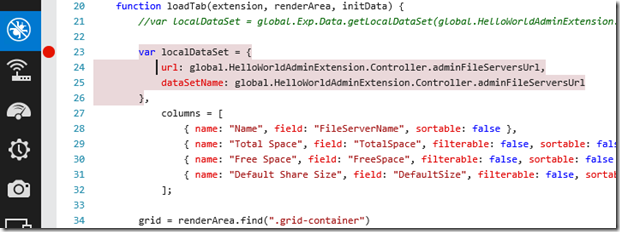
Open the source code file of interest and set a breakpoint:
Step 4 – Server-side debugging
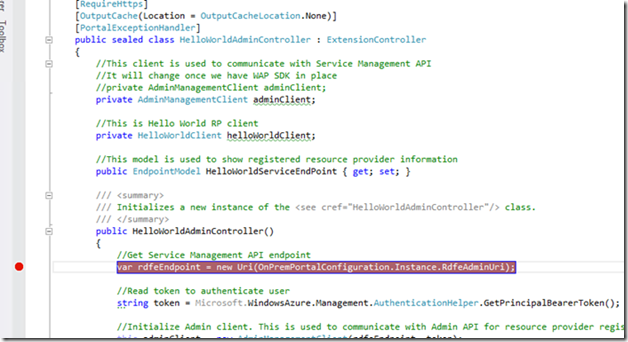
We will use Visual Studio to debug the Server-side functionality. Launch the IDE and open the Hello World solution. Open the HelloWorldAdminController.cs located under the Controllers subdirectory in the Microsoft.WAP.Samples.HelloWorld.AdminExtension project. Navigate to the constructor and set a breakpoint:
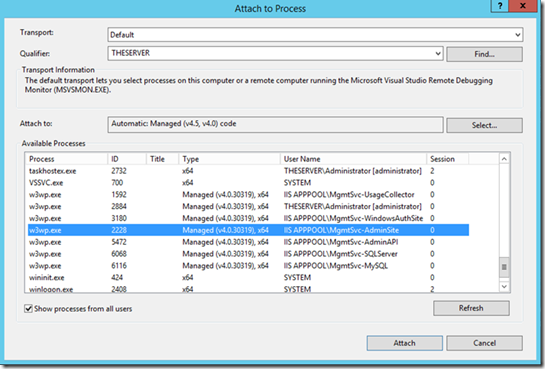
Now we have to attach the debugger to the W3W worker process serving the WAP admin site. Select the worker process with user name MgmtSvc-AdminSite and hit attach:
Step 5 – Additional Information Sources
Besides the steps described above, there are other sources of information that can help you to troubleshoot your extensions to the Hello World sample when something goes wrong or is not working as expected. Some of the sources available are:
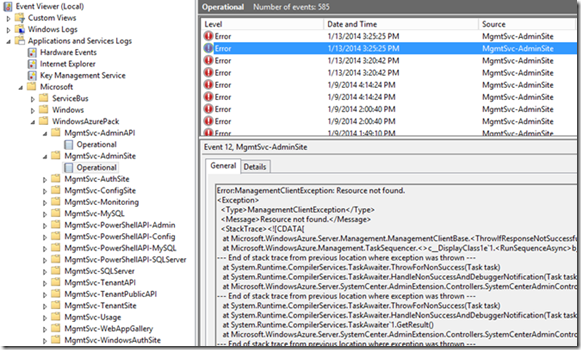
Eventlogs
WAP installs a custom application event log for every service located under “Application and Services Logs\Microsoft\WindowsAzurePack”:
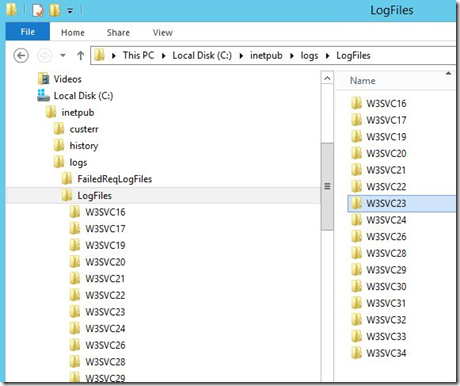
Another useful source are the W3W IIS logs:
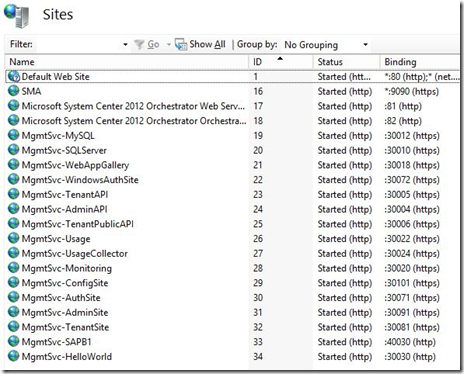
The easiest way to identify what directory contains which log file is a screenshot from the IIS management snapin:
Where the ID is the last number in the log directory name.
Until next time! Torsten
