Installing & configuring Service Reporting for IaaS usage and metering
This is the last blog post in a series on how to enable usage and metering for IaaS using System Center and Windows Azure Pack.
The series includes the following posts:
- IaaS Usage and Service Reporting using System Center 2012 R2 and Windows Azure Pack
- Configuring VMM and OM for IaaS usage and metering.
- Configuring SPF and Windows Azure Pack for IaaS usage and metering.
- Installing & configuring Service Reporting for IaaS usage and metering. (This blog post).
Service Reporting is a new components in System Center 2012 R2, and in this blog post I’ll go over how you can install and configure it by doing the following:
- Installing Service Reporting
- Configure Service Reporting to extract data from Windows Azure Pack
- Verifying data gets processed in the cubes
- Make a simple dashboard in SharePoint.
The following things must be configured before starting on this guide
Completing all steps and pre-requisites from the previous blog posts:
- Configuring VMM and OM for IaaS usage and metering.
- Configuring SPF and Windows Azure Pack for IaaS usage and metering.
Additional to the two prerequisites described above, the following components are needed:
- SQL 2012 SP1 or higher running Analysis Services
- SharePoint 2013 Enterprise with PerformancePoint enabled.
The Environment:
| Operations Manager Server: | OM01.contoso.com |
| Operations Manager DB Server | DB03.contoso.com |
| Operations Manager DW Database Server: | DB04.contoso.com |
| VMM Server: | VMM01.contoso.com |
| SPF Server: | VMM01.contoso.com |
| WAP Server: | WAP01.contoso.com |
| Service Reporting Server: | DB06.contoso.com |
| Service Reporting Database: | DB06.contoso.com |
| SharePoint Server: | SP01.contoso.com |
Installing Service Reporting
The Service Reporting component will extract data from WAP Usage Service, transform the data and load it into the UsageAnalysis db.
Service Reporting is made up of three databases that are used for the ETL process:
- UsageETLRepositoryDB
- UsageStagingDB
- UsageDatawarehouseDB
The following requirements should be verified before starting the Service Reporting installation.
Verify that SQL Services (SQL Server, SQL Server Analysis Services & SQL Server Agent) are running under a Domain account and that this domain account has the required access to the UsageDatawarehouseDB databases instance where Service Reporting DB will be implemented. Also make sure that this domain account has read access to the System Center 2012 R2 Operations Manager databases.
To verify the SQL Service Accounts settings do the following:
1. Logon to the server where Service Reporting databases will be installed.
2. Launch SQL Server Configuration Manager
3. Under SQL Server Services, verify that the following services are running under a domain account.
To verify that the Service Account(s) has access to the database instance do the following:
1. Open SQL Management Studio as Administrator
2. Specify the server name for the Service Reporting SQL Database Server
3. Verify there is a login user for the service account (SQL Server & SQL Analysis Services) also verify that this user has the needed rights on the instance.
Note: It might be necessary to modify the access after the install of Service Reporting, for the user to have the needed access to the UsageDatawarehouseDB if this is not granted at the instance level.
4. Do the same for the database server holding the Operations Manager Databases
5. Verify that the SQL Agent Service Account has read access to the Operations Manager Databases.
To install Service Reporting do the following:
1. Login as an administrator that has Sysadmin rights on the database server where Service Reporting component is to be installed.
2. Mount the Orchestrator 2012 R2 media on the server
3. Run SetupOrchestrastor.exe
4. Select Service Reporting under the Service Management Section
5. Click Install
6. Click Accept and click Next to License Terms
7. Verify that all prerequisites are “passed”
8. Specify a path for the installation folder and Click “Next”
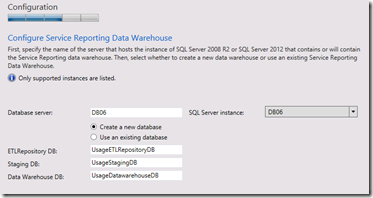
9. Specify the Database server and instance for Data Warehouse databases and click “Next”
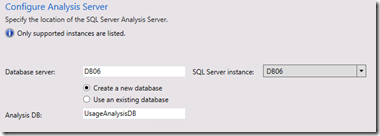
10. Specify the SQL Analysis Server where Service Reporting is to be installed and click “Next”
11. Click Next to Microsoft updates and review Installation Summery, if ok, click “Install”
12. Verify that the install goes well.
Configure Service Reporting to extract data from Windows Azure Pack
The Service Reporting component will extract data from the WAP Usage REST API. To get access to the data a user and password needs to me configured on the WAP Usage Server. To do this do the following:
1. Logon on to WAP Server and Start Windows PowerShell as Administrator
2. Load the WAP PS Module:
Import-module MgmtSvcAdmin
3. Set the User Name for the WEB Service:
Set-MgmtSvcSetting -Namespace UsageService -Name Username -Value '<User Name>'
Exmaple: Set-MgmtSvcSetting -Namespace UsageService -Name Username -Value 'SC'
4. Set the password for the user: Set-MgmtSvcSetting -Namespace UsageService -Name Password –Value ‘<Password>' –Encode
Example: Set-MgmtSvcSetting -Namespace UsageService -Name Password -Value 'Password1' –Encode
We have now created a user name and a password for the WAP Usage REST API, so Service Reporting will be able to extract usage data from WAP Usage Service. The next step is to configure Service Reporting to connect to the WAP Usage REST API. To do this do the following:
1. Login as an administrator on Service Reporting server.
2. Edit MaintenanceConfig.xml file under <InstallationDrive>:\Program Files\Microsoft System Center 2012 R2\Service Reporting\Maintenance folder
3. Update OM SQL Server Name and Database and WAP Usage Service in the XML file
Example:
<DataExtraction>
<ExtractSystemName>Service Reporting DW System</ExtractSystemName>
<ExtractProcessGroup>SR Data Extraction</ExtractProcessGroup>
<!--Start Register OperationsManager-->
<OperationsManagerSQLServers>DB03</OperationsManagerSQLServers>
<OperationsManagerDBs>OperationsManager</OperationsManagerDBs>
<!--End Register OperationsManager-->
<!--Start Register Windows Azure Pack Usage Service-->
<WAPUsageServiceURI>https://wap01.contoso.com:30022/usage?</WAPUsageServiceURI>
4. Open Windows PowerShell as an administrator.
5. Navigate to the <InstallationDrive>:\Program Files\Microsoft System Center 2012 R2\Service Reporting\Maintenance folder. For example, type cd “c:\Program Files\Microsoft System Center 2012 R2\Service Reporting\Maintenance” and then press ENTER
6. Run the following command to configure Service Reporting to talk to Operations Manager and WAP Usage REST API:
.\PostDeploymentConfig.ps1 –User <User from previous command> –Password <Password from previous step>
Example: .\PostDeploymentConfig.ps1 –User SC -Password Password1
Verifying data gets transferred from WAP and processed in the cubes
1. Logon to the Database Server that hosts Service Reporting Databases as an administrator
2. Start SQL Management Studio and connect to the Database Instance holding the databases.
3. Go to Databases folder, expand it and verify you can see the following Databases:
4. Select SQL Server Agent > Jobs
5. Verify that the following jobs shows:
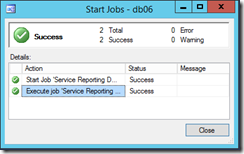
6. Right Click on the Service Reporting DW System Job and select “Start Job at Step..”
7. Click Start
8. Verify that the job completes successfully (This can take some time to complete)
9. Go to Databases folder, expand it and expand UsageDatawarehouseDB > Tables
10. Right clink on CloudDim and select “Select top 1000 Rows”
11. Verify that data shows in the table that is similar to below Picture
12. Click on “Connect” in the ribbon bar and select “Analysis Services”
13. Give the name on the server where Analysis Services is holding the Service Reporting Cubes and click “Connect”
14. Go to Databases folder, expand it and verify you can see the following databases
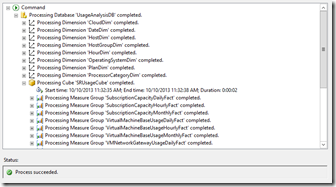
15. Right click on each Database and select “Process”
16. Click “Ok”
17. Verify that the processing goes well.
18. Click “Close” and close SQL Management Studio
Make a simple Dashboard in SharePoint
In order to show the data in the Data Warehouse we are using SharePoint 2013 PerformancePoint.
I will not explain how to install SharePoint, but will walk over the configuration of SharePoint PerformancePoint to connect to Data Warehouse.
I will give a few hints and tips. In this scenario I’m using SQL 2012 SP1 and SharePoint 2013
- Remember to install ADOMD.NET to allow SharePoint 2013 to connect to SQL from here
- Specifying Your ADOMD.NET Data Provider Version
- Configure a new site with Business Intelligence (PerformancePoint)
- Remember to configure a secure store with a user that has access to Data Warehouse
To create a sample Dashboard in SharePoint do the following
Create a data connection
1. Start a browser on the SharePoint Server and go to the new PerformancePoint site created for Usage & Metering
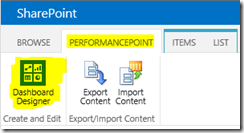
2. Select PerformancePoint Content and click on PERFORMANCEPOINT in the top menu and click “Dashboard Designer”
Note: If Dashboard Designer is used for the first time, the designer will install (Click Run) and console will launch.
3. Right Click on Data Connections and select “New Data Source”
4. Select Analysis Services and click “Ok”
5. Specify the server that holds the Analysis Services for Service Reporting
6. Click on the Database field and select UsageAnalysisDB from the list
7. From Cube select SRUsageCube
Note: Cubes must have been processed at least once to show in this list
8. Click Test Data Source and verify that connection is successful
9. Right Click on the New Data Source Rename and save the Data Connection
Create Reports
1. In Dashboard Designer console select “PerformancePoint Content”
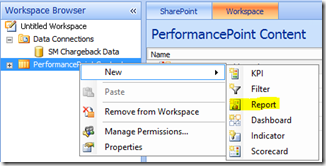
2. Right Click on “PerformancePoint Content” and select “New Report”
3. In the “Report Template” select “Analytic Chart”
4. Select the Data source that was created earlier
5. Give the Report a name e.g. “VM Runtime QTR”
6. Select “VM Runtime QTR” in the Workspace Browser
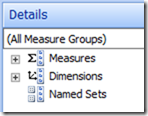
7. In the Details Pane Select “Measures”
8. In the Details Pane Select “Measures”
9. Expand “Measures” and scroll down until “Hourly VM RunTime Total” shows in the list
10. Select “Hourly VM RunTime Total” and Drag and Drop it over to the “Series” Box in the lower central pane
11. Go back to the details view and Extend Dimensions > Date > Calendar Quarter
12. Drag and drop this into the “Bottom Axis”
13. You should now see Data in the central window showing “Hourly VM RunTime Total” at the bottom of the Report
14. Repeat step 4-12 using the following details:
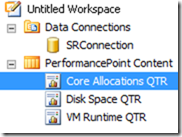
Name of Report Series value (Measures) Bottom Axis (Dimensions) Core Allocations QTR Daily Core Allocated Date Calendar Quarter Disk Space QTR Daily DiskspaceAllocated Daily DiskspaceUsed Date Calendar Quarter 15. There should now be 3 reports in the Performance Content View
Create a Dashboard
1. In Dashboard Designer console select “PerformancePoint Content”
2. Right Click on “PerformancePoint Content” and select “New > Dashboard”
3. In the “Select a Dashboard Page Template” select “3 Columns” and click “Ok”
4. Give the Dashboard a name E.g. VM Dashboard under “Workspace Browser windows”
5. Click on Name (Page 1) and Rename it to VM Dashboard.
6. In the Details pane extend “Reports” > “PerformancePoint Content”
7. Select “Hourly VM RunTime Total” and drag and drop it into “Dashboard Content” > “Left Column”
8. Do the same for “Core Allocations QTR” and drag & drop this in the “middle Column”
9. Drag and drop “Disk Space QTR” to the “Right Column”
Publish a Dashboard to PerformancePoint
In order to publish the dashboard in SharePoint, do the following
1. Right Click on the dashboard just created and select Deploy to SharePoint
2. If prompted Select SharePoint Server and Version and Click “Ok”
3. A browser windows will open and show the Dashboard inside PerformancePoint
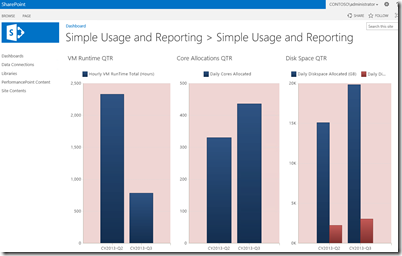
The Dashboard should look similar to the one below:
To drill Down on data do the following:
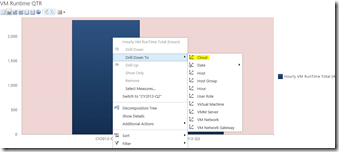
1. Click on VM Runtime QTR
2. Right click on one of the graphs and Select Drill Down To > Cloud
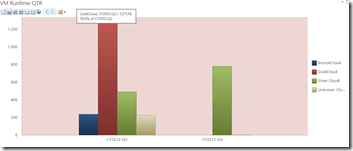
You can now see the number of VM hours pr cloud in the window.
If you hover over one of the pillars you can see the number of hours for a cloud for a given period of time.
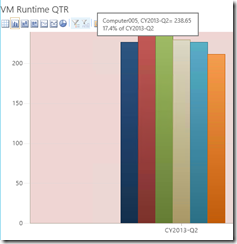
3. Right click on one of the graphs and Select Drill Down To > Virtual Machine
This will show you which Virtual Machine with the most VM Runtime hours within a give Cloud.
I hope this introduction to Usage and Metering using System Center and Windows Azure Pack will help you better utilize these new functions in R2.
Please let me know if you have any feedback on this series!
Happy Usage and Metering using System Center and Windows Azure Pack.


