Application Management - System Center Operations Manager Application Performance Management (APM) .NET Events – What do they mean?
Over the years I have used APM methodologies to track down problems and to assist in building better applications no matter the development processes used. One of the more important aspects of APM is to understand the details of the data that is collected. If you don’t use the data don’t collect it. Today I would like to start a deep dive discussion into SCOM 2012 .NET monitoring events and what the event details mean. First off, I will apologize for such a long post but I was asked by a few folks to talk about this subject and it is a fairly in depth subject.
Types of Events
In SCOM .NET Application Monitoring there are two basic types of events. When I talk about events these are the details collected and rendered in SCOM App Diagnostics Web Portal not the alerts that are in the SCOM console, although the alerts can be based on events but not always are they directly correlated to each other. The basic events at the highest level are Performance and Failures. A simple understanding is that performance events are when a threshold of time is broken and failures are when an exception to code processing or error is seen to have happened. In these 2 upper level types there are variations.
Event Descriptions:
Event Type |
Description |
Performance - Client |
By using JavaScript and object events in the HTML Document Object Model (DOM), like the onClick event, timers track the request and time it takes to hit a ‘DOM Ready’ event. Details can be collected like image array and file array of downloaded resources. |
Performance - Server |
Collected by timing the entry point into the application breaking the ‘Alerting Threshold’ set in the monitoring template in SCOM. Entry points are simply the first function in the application to respond to the request. |
Failure - Client |
Created using JavaScript and listening to the JavaScript on error event in JavaScript. |
Failure - Server |
Similar to the frameworks built in ‘Catch’ method in .NET an event is created when failures meet the criteria set in the monitoring template. |
Event Deep Dive
Performance
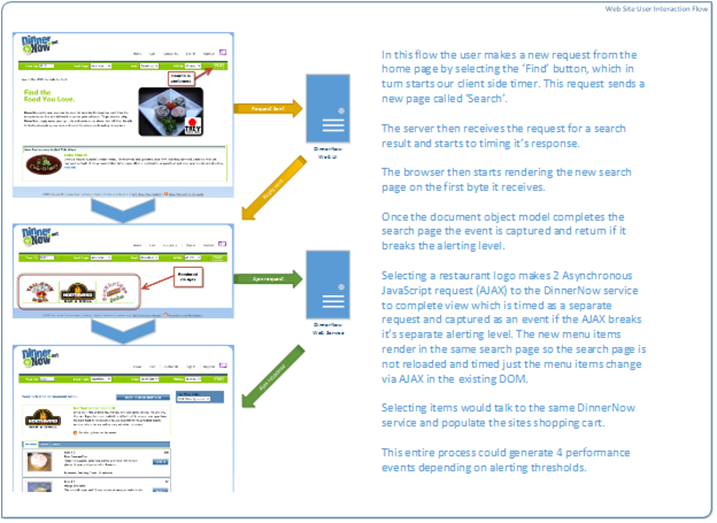
To review performance events lets first get an understanding of the life cycle of a web page interaction. In the following diagram we trace a simple user interaction while using a sites search feature. Of course not all sites are created equal and other methods of searching can and will be used by developers, let’s just use this to understand what and when details are captured.
I don’t know where else to say this so I’ll say it here. It is very important to understand the application flow and dependencies when configuring the SCOM template parameters like Alerting Threshold. If not set correctly there is a good chance you may not see the greater picture and not have the details to understand the real issues. In the flowing example there is a setting for alerting at the clients browser which should be X seconds. Think of how long should a user wait for the page to render. Then the server alerting needs to be set to some fraction of X, maybe even half of X since the server should build the HTML and send much quicker than the browser renders. If the server relies on other web services those should be a fraction of the server alerting time. Think of this as you go through this article, and “no” you do not need to know baselines or averages of your applications before you start. I can tell you I hate waiting more than 10 seconds for a page to load for me, that’s always my client starting point. J
Now let’s continue.
The orange arrows indicate the user’s initial request to the web site for search results which was triggered by clicking the ‘find’ button on the home page. On the client side performance monitoring this triggers the start timer for the resulting search page. Now we simply wait for the DOM ready event from the search page and decide whether the alerting level for a client page was broken. If yes an event would be created with the details based on options set in the SCOM monitoring template. The green arrows indicate one or more AJAX request being made and timers for each are triggered when the user clicks the restaurant logo which is a button. The resulting view is not a new page but simply a change in the current search page made by AJAX calls and the responses. Keep in mind the resulting events are all dependent on the SCOM templates alerting configuration/s. The following 4 events make up the performance monitoring transactions I collected from the above flow.
Reading from bottom up, since the most recent is on top, I see a client performance event for DinnerNow – Test (client) source and Client Page is the search page. This indicates the start of a performance problem. Drilling into the flow will show we can measure the time it takes a user from when he/she clicks the find button - to the time the page is fully rendered in the browser.
Client Side Performance
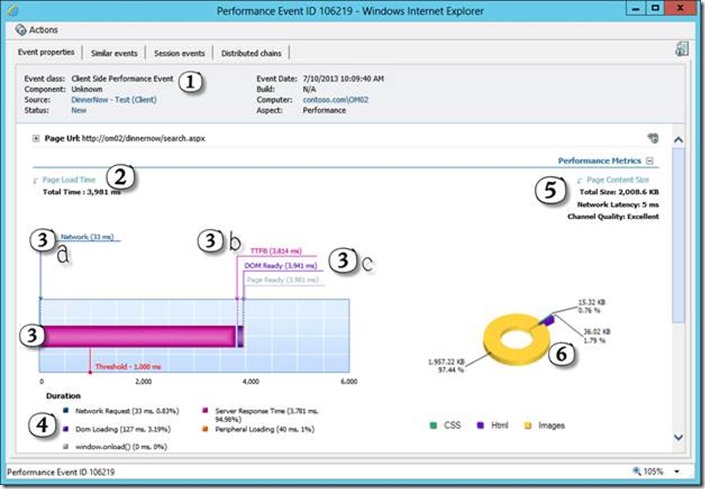
A client performance event and a server performance event look different, for a number of reasons. To understand a client event let’s highlight some of the basics inside the event details in the following
1. Header area, which is similar in a server event will indicate the time of event, server from where response was received, source name and include tabs across the top for additional data.
2. In the top left corner of the ‘Performance Metrics’ area is the complete time it took to render the entire page in the browser. In this case 3,981 ms.
3. This Gantt style or horizontal stacked bar chart indicates the entire time line of the page load and separates into measurable aspects that have been tagged.
a. Network request time is the time between the start ( button click in this case ) of the page to the time the server received the request.
b. TTFB is the ‘Time to First Byte’ which is when the first data packet is sent to the browser.
c. DOM Ready indicates the document object model as hit the ready state event although more downloads happen beyond that event depending on the browser types.
4. The duration section is another indicator of the timings involved in the overall page rendering. It can be seen as a key code to the Gantt chart.
5. Page Content Size is a section that starts to share details around total size of downloaded content along with an indicator of network latency which is a measurement made asynchronously by APM during a page load to test network capabilities.
6. Indicates a size breakdown of ‘Cascading Style Sheets’ (CSS), HTML and Images.
Scrolling down shows more details, again the depth is depending on the SCOM template settings for detail to include.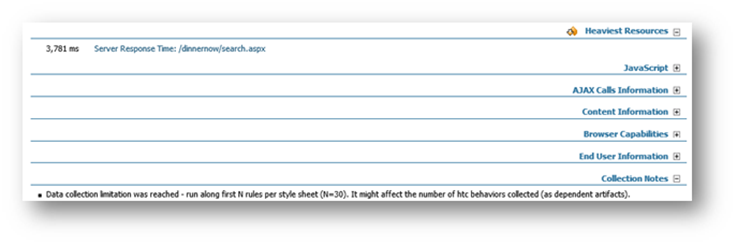
· Heaviest Resources is similar to slowest node in a server side event. I like to call this the root cause section of the event. Essentially it is what is mathematically calculated to be the highest percentage of time in the timeline. In this case it is showing the slowest part or root cause of the page rendering slow is the server responding to the request. Here it is highlighted as a link because it is a separate server event that is collected and correlated over for you. You can get to the corresponding server event by clicking the ‘Server Reponses Time’ link.
· JavaScript shows what takes place in the OnLoad JavaScript event, if anything.
· AJAX Calls show Information on any type of AJAX calls that take place during the timeline, essentially the part of the AJAX call that is included as part of the overall time.
· Content information section offers more detail about what was downloaded, when in the timeline it was download and what size of data was download to the browser, again it is dependent on configuration in the template.
· Browser capabilities is a standard list of what the configuration of the browser is.
· End user information will show the real IP address, dependent on load balancer and if the template is told about the load balancer. It also includes the user name if the site uses credentials in the standard way. User name is a searchable field in App Diagnostic’s portal.
· Collection notes are any special notes from APM that should be considered when view this detail.
As for the tabs across the top I won’t go into detail about them but I will generically describe what they include. ‘Similar Events’ is a grouping of events filtered on time and event signature allowing one to focus on triaging for severity and impact across multiple systems and environments. Distributed chains is interesting in that it will connect up events into a chain of interaction as they relate to each other. For example it will show this client event and if the server event was collected it will show it connected to the client event. For more information read this post here.![clip_image002[13] clip_image002[13]](https://msdntnarchive.blob.core.windows.net/media/TNBlogsFS/prod.evol.blogs.technet.com/CommunityServer.Blogs.Components.WeblogFiles/00/00/00/85/24/metablogapi/1307.clip_image00213_thumb_7254DDC9.png)
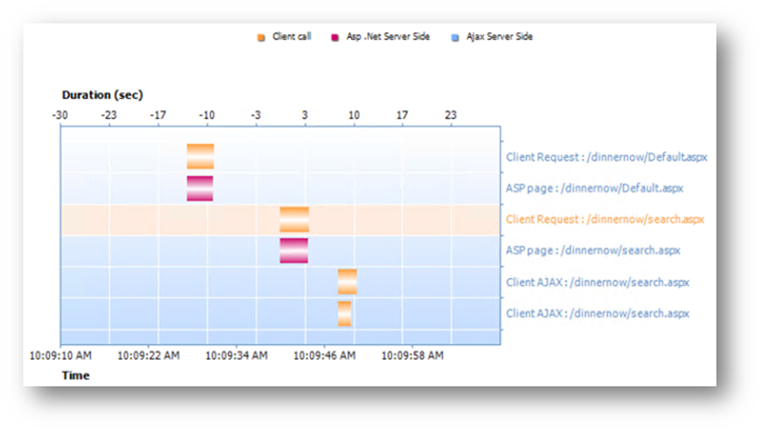
These distributed chains and similar events tabs are the same tabs seen in server side events. The session events tab is slightly similar to chained events except its correlating events based on time with session id, user name, or IP address. See the following example.
Server Side Performance
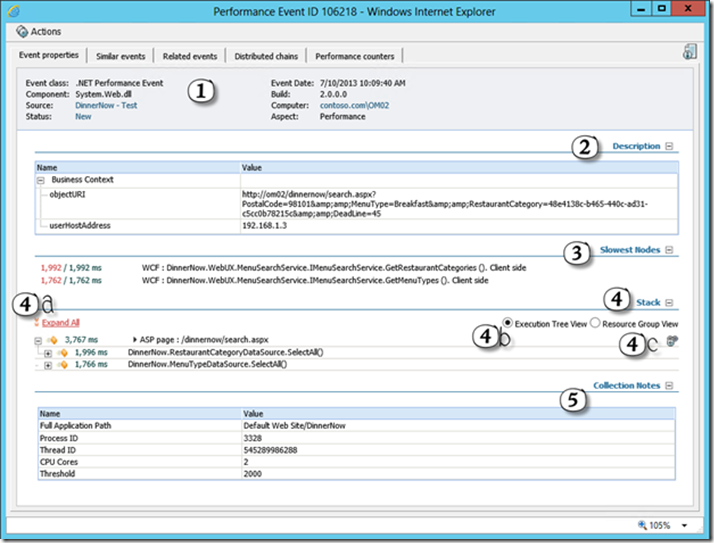
Some of the same data is shown in a server side performance events but there are major differences in how those are presented and there are certainly differences on what can and is collected. In a server side performance event we have slightly more control over collection of additional data like CPU performance and memory utilization see we do gather those.
1. The header area, again, is very similar to all events in that it will indicate time, date and where the event comes from.
2. Description is where we find business context like IP address from the user as well as the full URI that includes query string and data. This is typically how you can recreate some request and problems caused by them.
3. Slowest nodes indicates the root cause of this event, but essentially it is a mathematic calculation of the slowest nodes in the Stack tree.
4. The Stack or Resource view (Details here will be discussed a little later in this section.)
a. A performance stack tree of the code that application code. This is very dependent on namespaces and sensitivity level settings in the SCOM template.
b. Radio buttons that control the views rendered in the Stack view.
c. Chain Icon indicates that this event is part of a distributed chain. Clicking the Icon should open up the next in the chain, in this case the client event we reviewed above.
5. Details about the Process running this applications for use in diagnostics like crash dumps.
One of the most import aspects of the server event is the stack tree, both execution view and resource view. Let’s expand the execution tree view and discuss the details.
![clip_image002[15] clip_image002[15]](https://msdntnarchive.blob.core.windows.net/media/TNBlogsFS/prod.evol.blogs.technet.com/CommunityServer.Blogs.Components.WeblogFiles/00/00/00/85/24/metablogapi/2553.clip_image00215_thumb_09238979.png)
The ‘expand all’ hyperlink is self-explanatory, it expands the current tree view. The execution tree view is a hierarchy of program execution and timings, again based on sensitivity and namespace settings. Each line represents a method call and is part of the one it’s attached to preceding it in the tree above it and it’s time is included in the time of the one directly above it that it is attached to. Arrow bullets next to a method call means additional data was collected, like variables. We understand certain method calls deserver having there parameters collected by default and you can customize that list in the template. The variables for the entry point, or ‘ASP Page’ in this example are as follows.
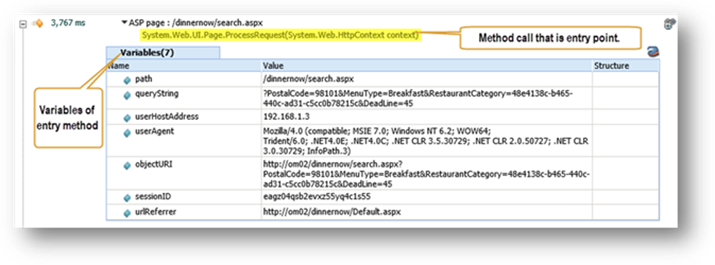
In some cases when function A calls function B, function A does other work like call function C. If function C doesn’t break sensitivity levels or it is in an excluded namespace (some namespaces are forced to be excluded by default) then function A’s time will include something called ‘Self Time’.

When hovering over the time signature of the method call it will show the ‘Self Time’ as well as the start and stop times of the method. In the above example 4 milliseconds of time was spent in the DinnerNow.MenuTypeDataSource.SelectAll method that was not collected as a sub method call. So it is self-time, time that the method did on its own.
Another view that can be useful when trying to understand or diagnose further details about the problems is called resource group view and highlights specific resources that are interesting.

In the above resource group view you can see specific methods are counted, timed and categorized to be rendered as a resource. For example the SQL ExecuteReader function is one of the pre-configured resources that will be timed and counted and included in the ‘SQL Client Calls’ node. We of course only show you details of the calls that break sensitivity which in this example the SQL calls are faster than the sensitivity so they are only timed and counted and the data about the call is not collected. But the 2 WCF calls do break the sensitivity and there details are collected. One very important note remember and data point to use in diagnosing is the amount of time in ‘Internal execution time’. Essentially this is code that ran that was not counted or timed as a resource (when in resource group view) and not included anywhere else in the tree. If you see ‘Internal execution time’ in the execution tree view it is all the methods or code that was not collected because it didn’t meet sensitivity or configured namespaces and was not part of Self-Time of another method. Very important to understand whether or not you are seeing the real root cause.
As for the tabs across the top they are similar to the client side event with the addition of 2 more. Related events is like the similar events tab only it shows things that are related to this single event by a soft correlation of time. The other new tab is Performance Counters. These are a 15 minute snapshot of specific performance counters leading up to the event. Again these are for further triaging and diagnosing of problems.
Application Failures
As we said earlier failures are either error events in JavaScript on client side or code exceptions on the server side. They are much easier to understand so they require less discussion here. One important note is around the icons that are used in the App Diagnostics portal to highlight Application Failures. Errors have 2 different icons. A  icon indicates a critical error to app monitoring. Essentially this is an error that has specific functions in the framework that respond to it when it is thrown. These do not have functions that developers built that handle them and not caught by the typical catch statement. These can be called unhandled errors although the handlers in a SCOM template are customizable so in some cases they can also be handled just categorized critical by adding its handler to the SCOM template. A
  or the inverse of the critical is a non-critical error or in other terms one that is handled by the developer in the code. For client side, depending on settings in the template, you get the JavaScript failure and can possibly get the JavaScript that failed captured as part of the event.
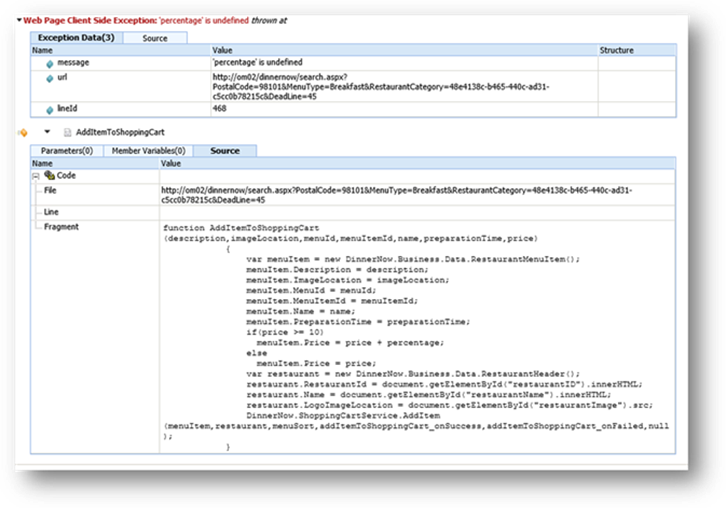
In the client error example above you can see in the source tab we captured the JavaScript function that actually failed. In the exception data section we collect the description of the error message, line number of the error and the URL with query string. This is useful information to take diagnosis further if need be but in many cases may actually tell you exactly what the problem is, as it does here. The ‘percentage’ variable was not declared before it is being used.
In a server side error the stack trace is directly from the exception stack in the framework with a slight difference. An exception stack trace has a specific purpose and is designed to be what led to the error in the framework at the time. They are read from the bottom up, unlike the performance events and are also controlled by settings in the SCOM monitoring template for whether or not they include details about functions.
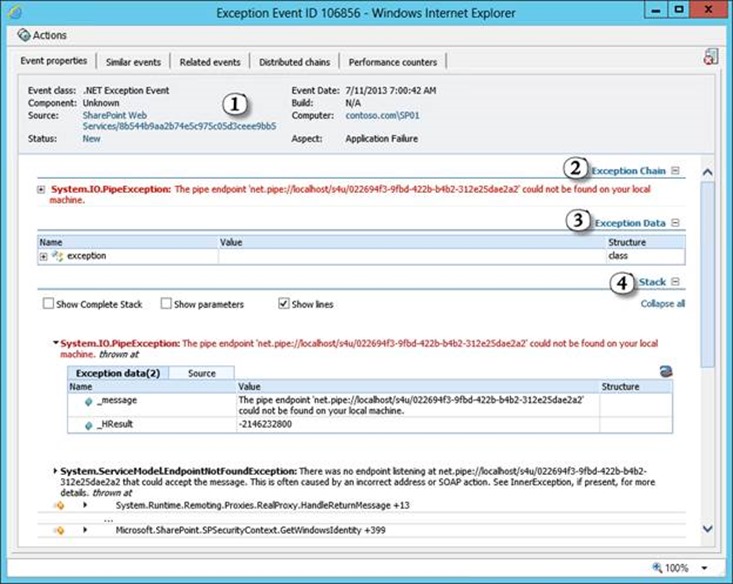
1. As with all the other events the header highlights important time and place of the event as well as tabs to additional information. Here, in an application failure it also categorizes with the aspect of the failure when it can.
2. Exceptions can happen in a chain of failures and here we capture that chain of failures and render back the outer most that is highlighted in red font. Some are single failures and just show that exception from the framework.
3. The exception object in the framework includes variables like the message from the framework about the error and the HResult code back from the framework.
4. The stack trace can be one of the most important diagnostic tools to a developer but also can include additional details like parameters a function uses or expects to use. We’ll disucss the stack trace as we render it in the event details separately below. There are check boxes above the stack that allows showing more details if needed.
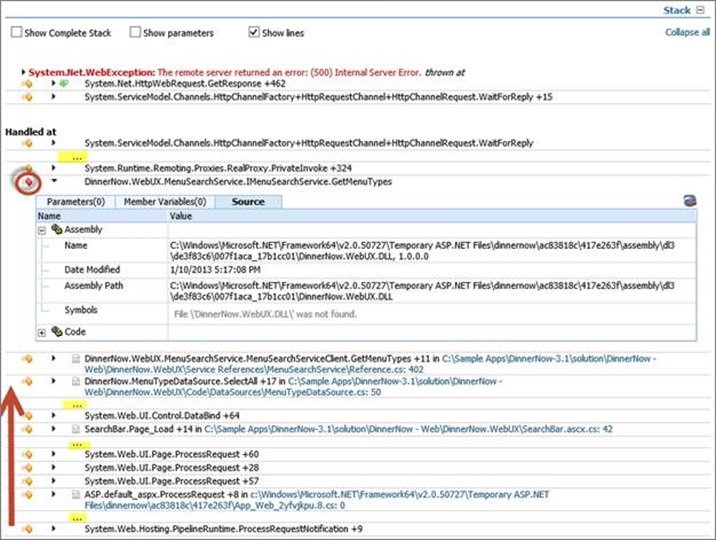
The first thing you’ll notice about the stack trace is that it doesn’t always show in the event. During rendering of the event details it is decided, based on things like failure aspect how the stack will be rendered, if at all. When it is rendered it is rendered as what I like to call a relevant stack trace. In this example notice the ellipse which is an indicator you are only seeing relevant lines of the stack and not the entire stack. Remember a stack trace flows from bottom up. Something else to take note of is the series of ‘flying box’ icons next to each line and in this example below the one circles is red. This red flying box indicates the method call that the exception was captured in. So this event shows the web application failed in the ‘GetMenuTypes’ function which was trying to open a remote proxy communication to a web service and the web service responded with a 500 error.
When you check the box show ‘complete stack’ it then renders this. The ellipses are now expanded to greyed lines of code in the stack. These additional lines, as you can see, are less important or less ‘relevant’ to solving the problem and in many cases very rarely need to be viewed. Each line also includes a + and a number at the end which represents the CLI offset of that line of code. This offset can be transferred over to real source code line numbers by developers and using something ILDASM or by the APM monitor if developers deploy debugging symbol databases with the code. Here in the below example they are highlighted in blue as a hyperlink with the source code file name. Not always very helpful but it does speed a developers time to find the failing line in source code.
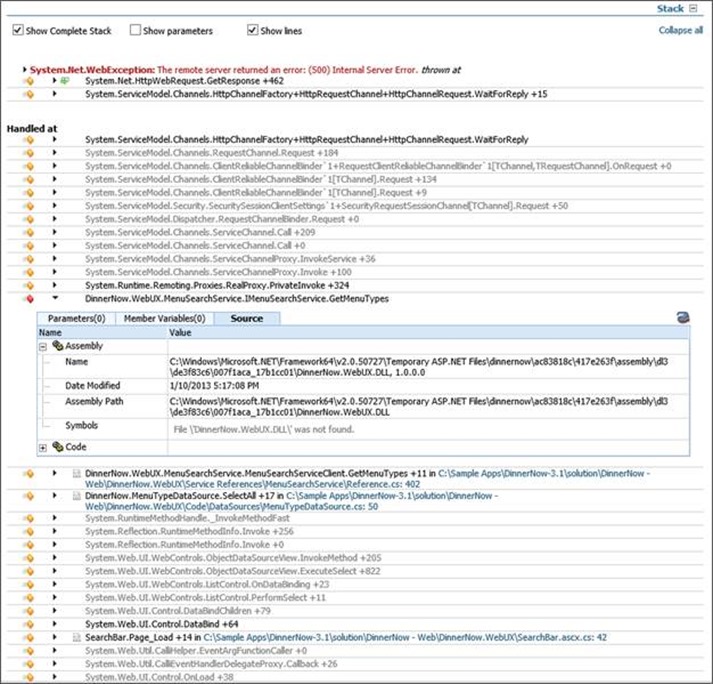
Some more details can be seen when a line also includes the  icon. This icon indicates parameters not only where expected but they were collected as seen in the following example. You can see all the parameters used to perform the GetResponse method which is the web service in this case that failed to respond. In some cases if the web service is .NET and monitoered it could be chained to his calling failed event, but in this case a 500 error also indicates, .NET wasn’t even in play yet so .NET monitoring won’t have details of it.

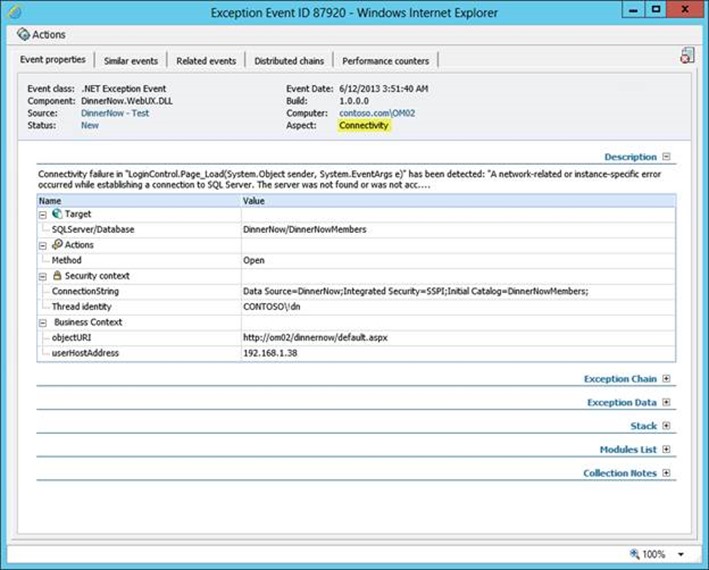
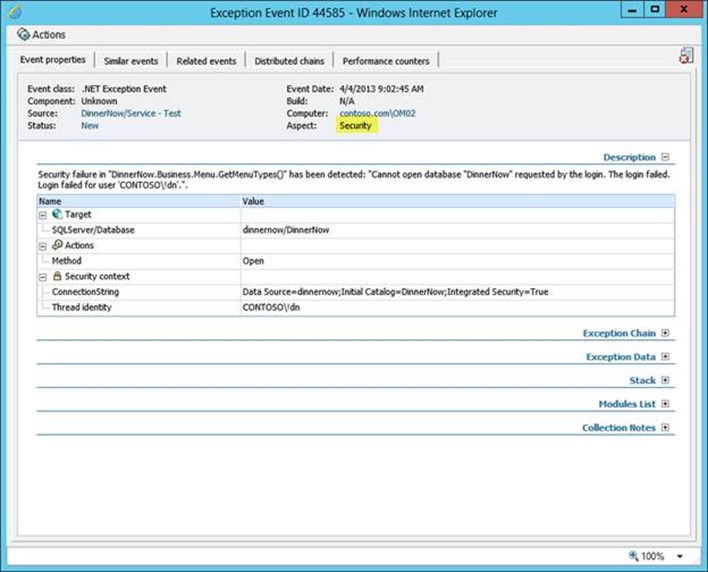
Exceptions that meet certain criteria, like a description suggesting you could connect to something are further categorized as the Aspect of a ‘Connectivity’ or ‘Security’ failure. We then hide the stack trace in the view and show relative information to the security or connectivity failure as in the connectivity example.
Here is another example, this is of an application failure that was categorized as security.
Summary
In closing, each event doesn’t have to directly correspond to an alert in SCOM but by setting the correct template configurations you can be alerted to the more important ones and/or the increase in quantity of them without over alerting. Even without alerting the data in the app diagnostics portal is extremely valuable to understand over time the health of the applications you support or build. Also keep in mind each event is trying to highlight the root cause of why it was collected, but in some cases it may be caused by something outside of what was collected. .NET monitoring may just point you in the correct direction to begin the diagnostics but in the overall game of trouble shooting it should give you an edge.
