How to create a Service Manager Dashboard with SharePoint PerformancePoint - Part 3
In the two previous blog posts, we showed how Service Manager and PerformancePoint should be configured as well as discuss the background behind Reporting and how Service Manager can makes use of this.
To recap this is a tutorial of three blog posts:
Blog Post 1: Discuss the background behind Reporting and how Service Manager can makes use of this. (Previous blog post)
Blog Post 2: Show how Service Manager and SharePoint PerformancePoint can be integrated to show analytics' data in SharePoint. (Previous blog post)
Blog Post 3: Generating a dashboard based on data in Service Manager Data Warehouse. (This blog post)
In this blog post we will create the actual dashboard inside SharePoint PerformancePoint based on the connection we created to the Service Manager Chargeback cube in the Previous blog post.
In order to create the Dashboards the following should be done
Generating a dashboard based on data in Service Manager Data Warehouse
In SharePoint, we need to create the following items to create SharePoint PerformancePoint Dashboard using System Center Data Warehouse
- Create Analytic charts in Dashboard Designer that shows
- VM Day to Day spending
- VM Price by Cloud
- VM Price by User Role
- VM Price Sheet
- Create a Dashboard to show Analytics charts in SharePoint
- Publish a Dashboard to PerformancePoint & Drill Down
Let’s get started
Create an analytic chart in Dashboard Designer
1. Start a browser on the SharePoint Server and go to the new PerformancePoint site created earlier
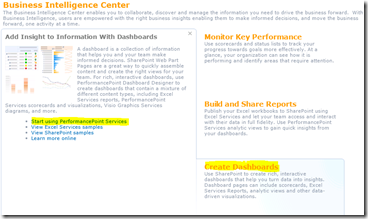
2. Click on “Create Dashboards” in the lower right side of the page and select “Start using PerformancePoint Services”
3. Click Run Dashboard Designer
4. In Dashboard Designer console select “PerformancePoint Content”
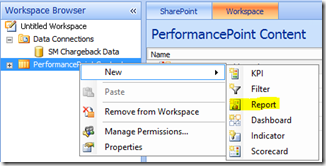
5. Right Click on “PerformancePoint Content” and select “New Report”
6. In the “Report Template” select “Analytic Chart”
7. Select the Data source that was created in the Previous blog post and Click “Finish”
8. Give the Report a name e.g. “VM Day to Day Spending”
9. Select “VM Day to Day Spending” in the Workspace Browser
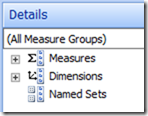
7. In the Details Pane Select “Measures”
8. Expand “Measures” and scroll down until “VM Total costs” shows in the list
9. Select VM Total Cost and Drag and Drop it over to the “Series” Box in the lower central pane
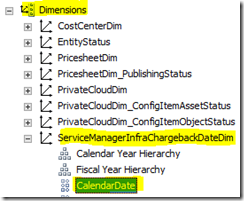
10. Go back to the details view and Extend Dimensions > ServiceManagerInfraChargebackDataDim > Calendar Date
11. Drag and drop this into the “Bottom Axis”
12. You should now see Data in the central window showing VM Cost and Dates at the bottom of the Report.
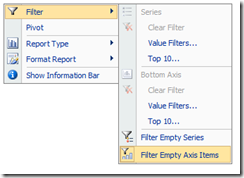
12. Right Click in the central view and select “Filter” > “Filter Empty Axis Items”
13. Repeat step 4-12 using the following details:
Name of Report Series value (Measures) Bottom Axis (Dimensions) VM Price by Cloud VM Total Cost PrivateCloudDim > DisplayName VM Price by Roles VM Total Cost UserRoleDim > Display Name VM Price by Price Sheet VM Total Cost PricesheetDim > Display Name
14. There should now be 4 reports in the Performance Content View
Create a Dashboard to show Analytics charts in SharePoint
In the same Dashboard Designer used when making the Reports do the following:
1. In Dashboard Designer console select “PerformancePoint Content”
2. Right Click on “PerformancePoint Content” and select “New > Dashboard”
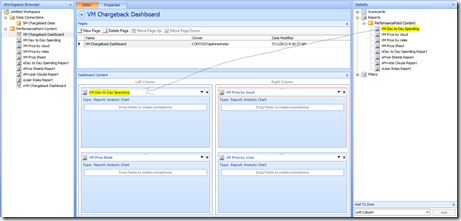
3. In the “Select a Dashboard Page Template” select “2 Columns” and click “Ok”
4. Give the Dashboard a name E.g. Chargeback Dashboard under “Workspace Browser windows”
5. Click on Name (Page 1) and Rename it to Chargeback Dashboard.
6. In the Details pane extend “Reports” > “PerformancePoint Content”
7. Select “VM Day to Day Spending” and drag and drop it into “Dashboard Content” > “Left Column”
8. Do the same for “VM Price sheet” and drag & drop this below the “VM Day to Day Spending” in the “Left Column”
9. Drag and drop “VM Price by Cloud” and VM Price by Role” to the “Right Column”
Publish a Dashboard to PerformancePoint & Drill Down
In order to publish the dashboard in SharePoint, do the following
1. Right Click on the dashboard just created and select Deploy to SharePoint
2. If prompted Select SharePoint Server and Version and Click “Ok”
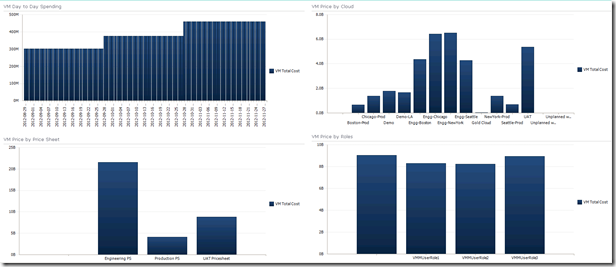
3. A browser windows will open and show the Dashboard inside PerformancePoint
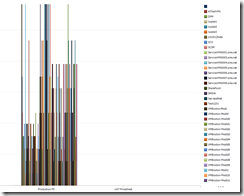
The Dashboard should look similar to the following
Drill Down on data in a Dashboard
In order to do drill down on data shown in the dashboard do the following
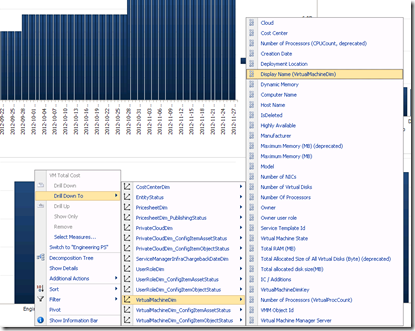
1. Right Click on pillar inside the “VM Price by Price sheet
2. Select “Drill Down to” > “VirtualMachineDim” > “Display Name”
3. Another report will show, where a drilldown of VM inside the Price by Price sheet pillar is shown
I hope this introduction to Service Manager and SharePoint PerformancePoint will help you better utilize these functions to show Dashboards in your organization.
Please let me know if you have any feedback on this series!
