How to create a Service Manager Dashboard with SharePoint PerformancePoint - Part 2
In the previous blog post we discuss the background behind Reporting and how Service Manager can makes use of this.
To recap this is a tutorial of three blog posts:
Blog Post 1: Discuss the background behind Reporting and how Service Manager can makes use of this. (Previous blog post)
Blog Post 2: Show how Service Manager and SharePoint PerformancePoint can be integrated to show analytics' data in SharePoint. (This blog post)
Blog Post 3: Generating a dashboard based on data in Service Manager Data Warehouse. (Next blog post)
In this blog post we will walk through how Service Manager and SharePoint PerformancePoint can be integrated to show analytics' data in SharePoint.
To configure SharePoint 2010 PerformancePoint and Service Manager 2012 SP1 correctly there are a list of things that must be done as pre-requisites for dashboards to work. These things must be configured before starting on this guide.
- Service Manager Server and Service Manager Data Warehouse servers are installed and connected
- Chargeback feature must be installed and configured (guide can be found here) to follow the example given.
- SharePoint 2010 Enterprise Server running with PerformancePoint installed (not configured)
- SQL 2012 Enterprise is installed with Analysis Services and SQL Management Studio
Assumptions
- All Components must be in the same domain or have full trust
- Admins access to all servers (SharePoint, System Center and SQL Server)
- Access to service accounts passwords for SharePoint
- Access to SharePoint administration wizard
- SQL Management Studio 2012 is installed with Admin access
Configuring SharePoint Site with a Dashboard using PerformancePoint
In SharePoint we need to configure the following areas to start using SharePoint PerformancePoint with System Center Data Warehouse
- Create a new site in SharePoint using Business Intelligence
- Generate Secure Store for PerformancePoint
- Add SharePoint Service Account to Database users
- Install SharePoint Dashboard Designer
- Create a connection to System Center Data warehouse and verify connection
Let’s get started
Create a new site in SharePoint using Business Intelligence
Note: It’s recommend using a dedicated SharePoint Server for this solution described for testing and not to use a production system
1. On the SharePoint Server login as Administrator
2. Click “Start > All Programs > Microsoft SharePoint 2010 products > SharePoint 2010 Central Administration”
3. Start SharePoint Configuration Wizard
4. Select “Launch the Farm Configuration Wizard”
5. Click “Start the Wizard”
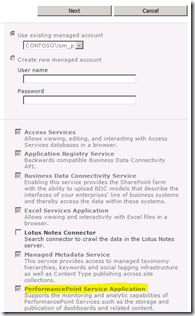
6. Select “Use existing managed account”, and leave default account as it is
7. Verify that “PerformancePoint Service Application” is checked as enabled
8. Click Next
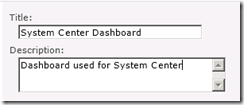
9. Type SCDashboard in Title or similar name
10. Select “Sites” for URL and type “SCDashboard” or similar for Site.
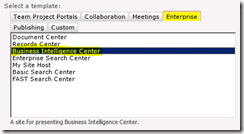
11. Select “Business Intelligence” under “Enterprise” Tab in Template selection
12. Click “OK”
13. Click “Finish”
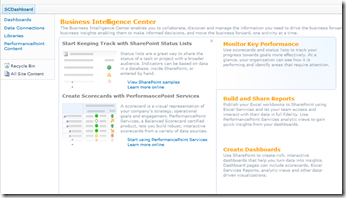
14. verify that the new site is up and running by going to https://localhost/sites/SCDashboard
Generate SecureStore for PerformancePoint
In the same browser used when making the PerformancePoint site do the following:
1. Click “Central Administration” in SharePoint 2010 Central Administration
2. Select “Manage Service Applications” under Application Management
3. Select “SecureStore Service”
4. Select Generate a new key for ribbon
5. Type a password and click “Ok”
6. Click “Application Management > Manage Services Applications”
7. Select “PerfromancePoint Service Application”
8. Select “PerformancePoint Service Settings”
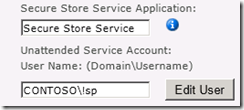
9. Type the service account used for SharePoint services for Username and Password
10. Click “Ok”
11. Click “Central Administration” > “Application Management” > “Service Application” > “Configure Service Application Association”
12. Verify that PerformancePoint Service and Excel Services is in the list of Application Proxies, If not do the following
a. Click on “Default” under Application Proxy Group
b. Select “PerformancePoint Service” checkbox and click “Ok”
This will enable Excel Power Pivot to show inside a Dashboard if needed
Add SharePoint Service Account to Database users
1. Login as a Database Administrator on a server where SQL Management Studio is installed
2. Start SQL Management Studio and Select Database Engine , specify SQL server name and Instance and Click “Connect”
3. In SQL Management Studio expand Security
4. Right click on the “Login folder” and Select “New Login”
5. Click on “Search”
6. Select the domain where the SharePoint Service Account is located
7. Type the name of the service account and click “Check Names” and click “Ok”
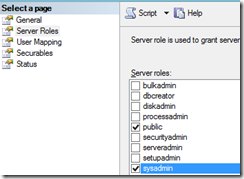
8. Select Server Roles and select sysadmin
Note: This is overkill but for this demo we are giving full access, please discuss with your DB administrator what the needed rights required should be.
9. Click “Ok”
10. Verify that the SharePoint Service Account now appears under Logins
11. Close SQL Management Studio
Install SharePoint Dashboard Designer
1. Start a browser on the SharePoint Server and go to the new PerformancePoint site created earlier
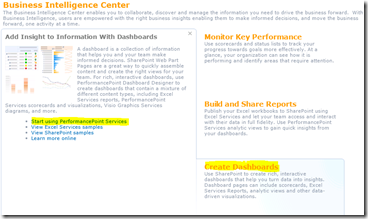
2. Click on “Create Dashboards” in the lower right side of the page and select “Start using PerformancePoint Services”
3. Click Run Dashboard Designer
Note. To run this application on the server it needs to be connected to the Internet, if the server is not connected to the Internet it would have to be downloaded manually
4. Click on Run to install the Dashboard Designer.
5. The Dashboard designer will now install and after a few minutes it will open the Dashboard Designer console
Create a connection to System Center Data warehouse and verify connection
1. in Dashboard Designer console select “Data Connections”
2. Right Click on “Data Connections” and select “New Data Source”
3. Select “Analysis Services” as Template and Click “Ok”
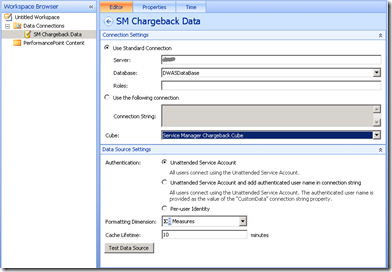
4. Give the Data Connection a name e.g. SM Chargeback Data
5. Specify the Server that is running Analysis Service for Service Manager Data warehouse for the Server field
6. Click the drop down and select DWASDataBase for the Database field
7. Click the drop down and select Service Manager Chargeback Cube for the Cube field
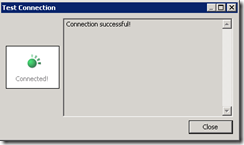
8. Click “Test connection” to verify that the connection is working
We have now created a connection to the Service Manager Data warehouse and the Service Manager Chargeback cube in PerformancePoint. This will allow us to start creating dashboards that we can show in SharePoint. This blog post is focusing on configuring the different components, which we have completed above. In the next blog post we will start creating a dashboard that show Chargeback analysis.
Have fun and please let me know if you have any feedback or comments.


