How to create a Service Manager Dashboard with SharePoint PerformancePoint - Part 1
In System Center Service Manager 2012 a new data warehouse is introduced, which brings new capabilities to reporting in the Datacenter. In a series of blog posts, I will explain how this can be implemented using Service Manager 2012 and SharePoint PerformancePoint.
As with previous posts, I will divide the “subject” into three parts
Blog Post 1: Discuss the background behind Reporting and how Service Manager can makes use of this. (This Blog post)
Why data warehouse is important, and explain the architecture behind the data warehouse
Blog Post 2: Show how Service Manager and SharePoint PerformancePoint can be integrated to show analytics' data in SharePoint. (Can be found here)
Step by step guidance that explains how to configure SharePoint PerformancePoint to work with Service Manager Data Warehouse
Blog Post 3: Generating a dashboard based on data in Service Manager Data Warehouse.
Walk through an example where Service Manager data is shown in SharePoint as a “Dashboard”.
The Scenario
In this series of blog posts I will show how chargeback data generated from an earlier series of blog posts (here) can be presented in a dashboard using Service Manager Data Warehouse and SharePoint PerformancePoint.
This will allow consumers of clouds to see analytics from chargeback data in a SharePoint webpage as a dashboard.
Why use a Data Warehouse?
There is a list of reasons why it’s a good idea to have a Data Warehouse for Service Management and not use the Service Manager Database:
- Have a Non-transactional data store that doesn’t interfere with day to day operations (Service Manager Database)
- A solution that ingests & optimizes data for fast reporting & analysis
- Automatically reconciles data from different sources
A data warehouse is optimized for aggregating and analyzing a lot of data at once in a lot of different, unpredictable ways. This differs from transactional processing systems which are optimized for write access on few records in any given transaction, and those transactions are very predictable in behavior.
The architecture behind Service Manager Data Warehouse
The architecture is buildup of several components.
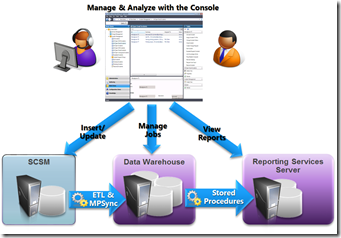
Service Manager Server: This server delivers data from the different Management Packs to the Data Warehouse component using the ETL (Extract, Transfer & Load) standard. Management Packs Are also Sync between Service Manager and Data Warehouse, so the two components always has the same configuration.
Service Manager Data Warehouse: Stores data in a format optimized for fast querying and storage data from multiple Service Manager instances plus other data sources from the rest of the System Center suite. The Data Warehouse makes use of OLAP (Cubes) by using a data structure which providing rapid analysis of data. BI Cubes are created to make it easier for the Reporting Analyst to generate reports based on data in the data warehouse.
Service Manager Reporting: This component provides a list of features using existing Microsoft technology and present data in the following ways:
- Use Reporting Services
- Use Power Pivot in Excel
- Use SharePoint PerformancePoint
By using one or more of the above reporting features, data from the cubes can be presented to the analysts as reports, excel spreadsheets or dashboards.
The illustrations below shows how the architecture and concepts are working in Service Manager Data Warehouse.
Use SharePoint PerformancePoint to create dashboards
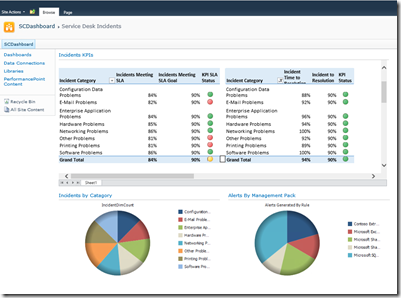
You can use PerformancePoint to create dashboards for your organization. A dashboard is essentially a collection of scorecard and report views that dashboard users can view in a web browser.
PerformancePoint dashboards are dashboards that are created by using PerformancePoint Services based on data in a Data Warehouse. You can create dashboards that display information from a variety of sources by using PerformancePoint designer to build up your dashboards.
Below is an example of a dashboard that is created in SharePoint PerformancePoint based on Service Manager data
In the next blog post I will take a look at how Service Manager and SharePoint PerformancePoint should be configured to work with dashboards
Stay tuned and see you after TechEd US for the next blog post in the series of three.


