Application Management through Monitoring – Part 2 of 3 – Synthetic Monitoring
In part 1 of this 3 part series we discussed the reasons why we monitor and we talked about the different types of monitoring we can use. In this blog post we'll dig deeper into the Synthetic monitoring styles and more importantly when and where to use them. The purpose of this series and especially this blog post is not to show or map the best practices of any one type of monitoring but to show some different ways of thinking about monitoring applications, especially custom line of business applications. This blog post should simply show there are options and features available that can bring benefit in many ways, some you may have never imagined.
When to Use
In the past and even still today this synthetic monitoring has been referred to as End User monitoring. I would even suggest for the most part, incorrectly. It gets this reference since its design is to simulate how end users use the application and in some cases simulate a transaction through the application. I say this is not end user monitoring since you are not monitoring the end user. We'll discuss real end user health monitoring in part 3, but as I will hopefully show a synthetic view of the applications response to a request still has value. I also do not limit them to only web application requests since we have other types of synthetic transactions, for example a SQL Select statement on a regular cycle from a node or nodes in the environment can confirm SQL responds as you would expect.
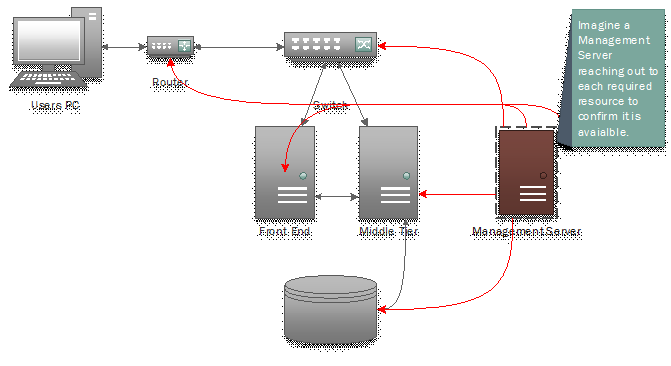
Figure 1 ( Synthetic requests in red )
In figure 1 above we are showing that there can be many use cases of synthetic monitoring. For example a GET request to https://<my web server >/ will show the site is available which includes the network devices in between the management server node and the web site server. If the response is slow or not at all have we then understood availability from that node? But let's say I create 2 availability monitors, the "web" request as before and another one into the Middle Tiers web server like this: GET https://<my middle tiers url>/myservice.svc, if it is a .NET WCF service. An example result would be, if the UI doesn't respond but the service does then you narrow the problem and severity to the Front End server and or network between. In addition, with infrastructure monitoring and code level monitoring I can now rule in or out the server or server OS as part of the problem, so now we are triaging and to some degree diagnosing by way of monitoring.
What to use
Hopefully I've made you have some different thoughts around when to use synthetic transactions, which essentially is when do you want to understand the health of something. Maybe it's not as easy as that since not everything can be interacted with via an agent or request. Let's take a look at what I would call my top list of synthetic transactions, again keep in mind health includes performance and availability.
What |
Used for |
Perspective |
Web Application Availability Monitoring - GSM(Global Service Monitoring) |
Web sites and web services - single |
From local and remote |
Visual Studio Web Test Monitoring - GSM(Global Service Monitoring) |
Web sites and web services - multiple |
From remote |
Web sites and web services – recorded |
From local |
|
Database response |
From local |
|
TCP Port availability |
From local |
Yes I included TCP Port Monitoring as a synthetic transactions type. Let's just call it a pseudo synthetic transaction monitor simply because its goal is the same, to give you a perspective of connectivity from dispersed nodes. In the next section we'll discuss more how to use each of these, but in general they are simply pieces of the 'ALERT -> TRIAGE -> RESOLVE' puzzle. Even though the first three are for Web Sites and web services they are fundamentally different in several ways. The first and most significant difference is from what perspective they are from. The first 2 will offer a perspective from your own internal nodes, just like the rest, but they also offer views from the MSFT GSM (Global Service Monitoring) nodes around the world. Let's briefly describe each.
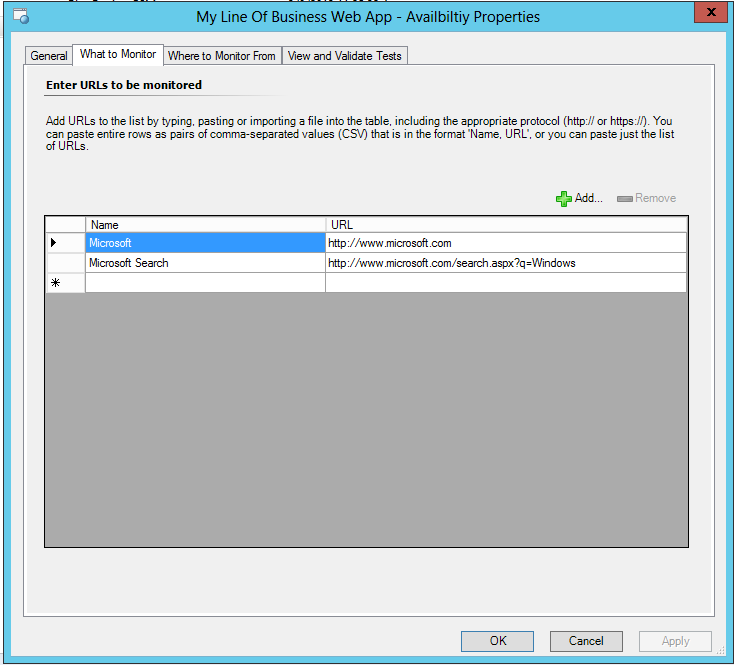
Web Application Availability Monitoring – Allows you to create HTTP Get and/or Post request to multiple URL's (keep in mind there are limitations in GSM which makes Visual Studio Web Test slightly better for larger monitors) You will be able to understand health via the response from the request and can trigger different alerts for different responses but you will also be able to see responsiveness via timing the request. You do have the ability to modify the granular level of timing. You have control over headers sent, alerts created and performance data collected. Here are some setting options:
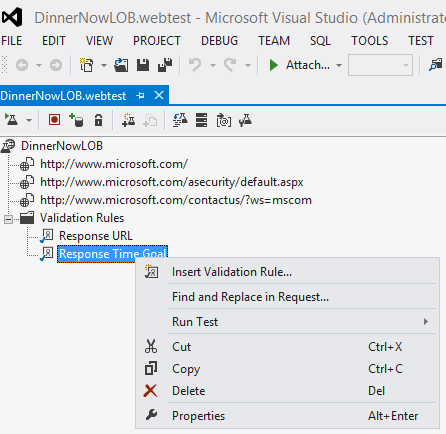
Visual Studio Web Test Monitoring – Very similar to the Web Availability monitoring when it comes to selection of perspective. You will only be able to use GSM nodes. Where it differs is on the detail collected and alert capabilities. Essentially it is not as rich in configuring from SCOM, but what it lacks there it makes up for in the fact it is a Visual Studio Web Test package. This type of package can not only collect rich transaction data it can include more URL's to test and in return becomes a much better Global Transaction tool. It can include security credentials for a site that you test. (Instructions on creating a web test can be found here) See example VS Web Test:
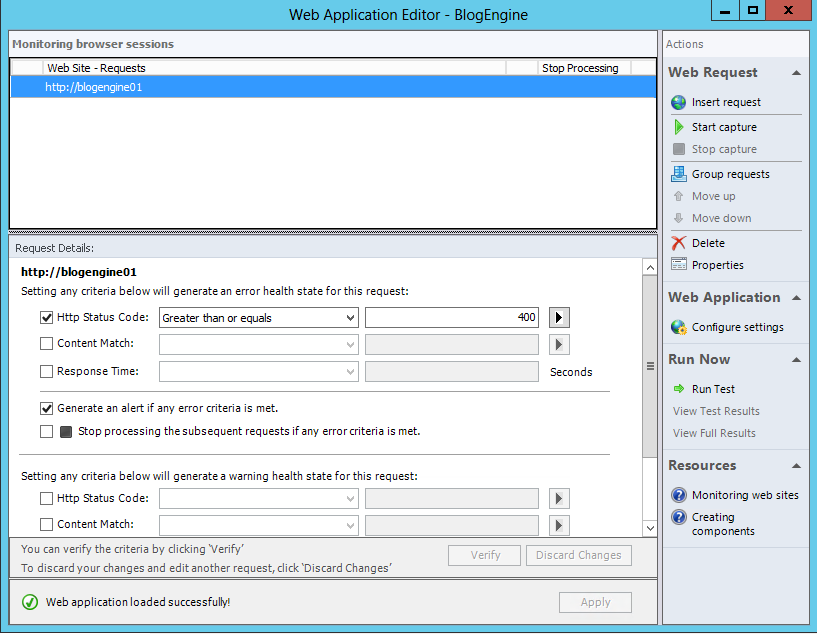
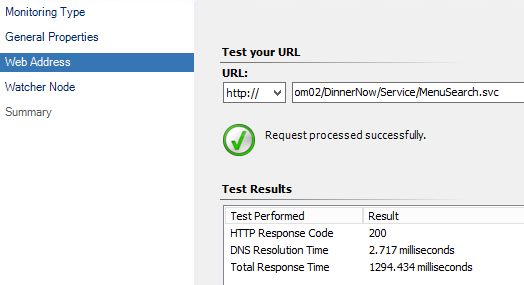
Web Application Transaction Monitoring – I now, since the release of SC 2012 SP1, think of web transaction monitoring as the alternative to Visual Studio Web Test Monitoring. It differs in many ways but for a simple guy like me, it is local nodes as well as GSM and allows for wider control of alerts created based on response codes, content and timing. It is similar because it is a recorded walk through of a transactions. Sometimes it's not easy to find out where and how to set up but if you select 'Configure Advanced Monitoring or Record browser session' in the initial templates summary page you will see the Web Application Editor. This comes with the ability to authenticate and record a web transaction and convert the results into health status of the application. Further, it collects request performance counters to understand deeper the relationship of resources like content size, DNS resolution, redirects and more. I refer to these as trouble shooting counters as they help triage and resolve problems. So as an alternative you can see it's a powerful alternative.
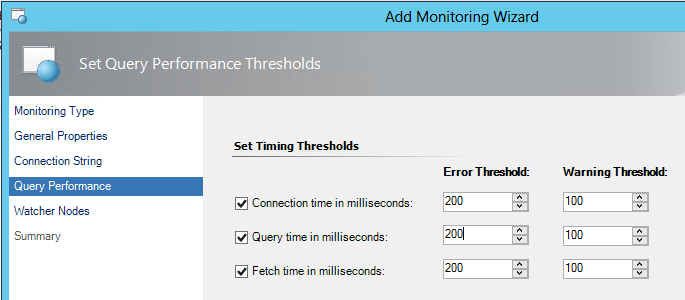
OLE DB Data Source and TCP Port Monitors – I include these together for a brief explanation around setup since they are somewhat self-explanatory. These monitors allow you to reach out and confirm a port or SQL databases is responding as expected. Along with many other monitors available, such as monitoring event logs and management protocols they help raise the awareness to issues but in general they highlight failures and dependent application components. Alert on DNS not responding on port 53 or HTTP not listening on port 80. Check of not just SQL is there and on but is the database you depend on responding to queries.
How to Use
We primarily focused on some of the synthetic tools to use so let's now focus on some use cases and how to use. As figure 1 is trying to show, there are many uses or ways of reading the alerts and reports that come from Synthetic monitoring. For this purpose I'll use a three tier web application I use often called DinnerNow. This application uses asynchronous calls to a middle tier wen service to populate drop downs with data and to respond to special requests like searching. Seems pretty straight for to create a web availability monitor for the user interface, right? Strangely enough for this application, if the web service is down the application will still respond to user interactions just fine. Here is what the home page looks like when the middle tier is broken. Look at the drop down menus for food item and meal type, see no data to select.
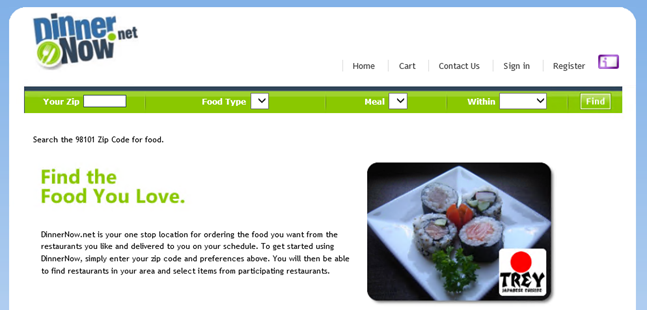
Image if you will that you also create a web availability monitor for the middle tier web service, which in this case responds to HTTP request similar to any web application. This is a better alerting mechanism but even better then alerting, it is the start of diagnosing the problem by telling us the service is not reponding in the middle as expected.
Now, in this example the user interface would respond even though data is not available. But also in this example the middle tier actually would respond correctly to the synthetic transactions because I simply took the database offline. The service is still available, it's just not working fully. The best method to understand the reason why would be to use .NET application monitoring of the .NET web service to understand why (we will detail more in Part 3), but what if it's not .NET. Well in that case the alert would be from our OLE DB monitor which would return the database is offline. Another way to expand the monitoring would be to include in the availability monitor all the different URLS and query strings that are important.
Hopes are this blog post simply spurs some additional thinking about monitoring applications but to some degree I hope it highlights that there are many ways to understand the health of an application if one doesn't fit use another. Now go forth and monitor…