VS2015 Remote Debugging JavaScript
VS2015 provides first class experience for debugging JavaScript code. You can leverage remote debugging features to debug JavaScript code on remote machine. The process can be internet explorer process or Windows Store App or it could even be a .NET application hosting browser control! Almost anything and everything you can debug on your local machine is available for remote debugging. This gives you a lot of power, for example, now you can debug your JavaScript code running in the QA or staging environment directly. You can follow few basic steps and get started.
Install Visual Studio 2015 on a development machine
Most developers know how to do it so I'm not going through the details.
Install VS2015 Remote Debugger on the target machine
Visit https://www.microsoft.com/en-us/download/details.aspx?id=48155&NavToggle=True and download 32-bit version for 32-bit (x86) operating system and 64-bit version for 64-bit (x86) operating system. You can install remote debuggers on the Windows OS that uses ARM based processor as well.
Note: You should install 64-bit remote debugger on 64-bit machine to debug 32-bit and/or 64-bit processes.
Double click on rttols_setup_x64.exe and select I agree… checkbox to accept the EULA. Click on Install to Continue.
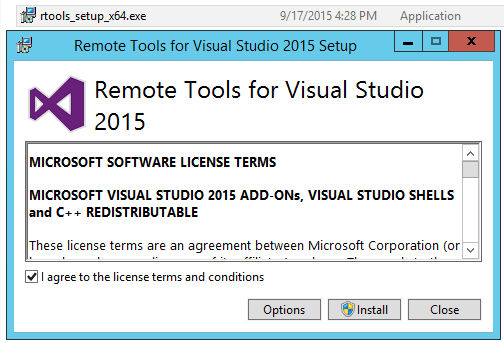
Note: Options allow you to specify install path which may not be required in most cases so you go with default options.
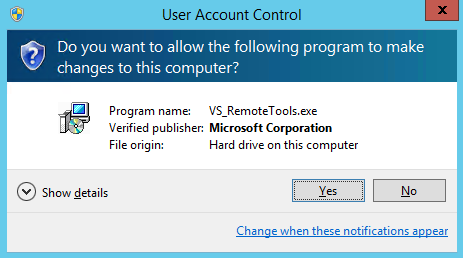
Click on Install and you'll be prompted with UAC (User Account Control) dialog box. You need administrative privileges to install remote debugging tools. Click on Yes to continue with the installation.
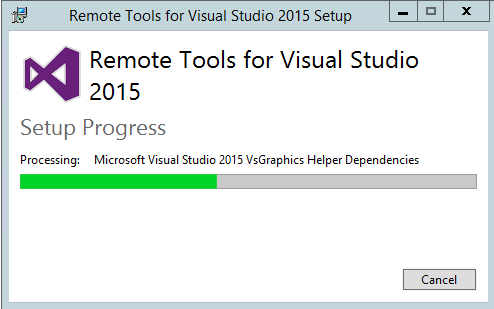
The setup will install the necessary files and may take a moment or two.
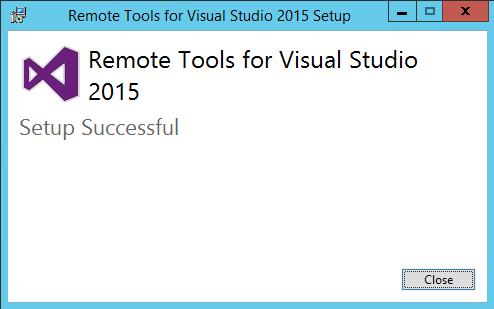
Click on Close and you are done with the installation.
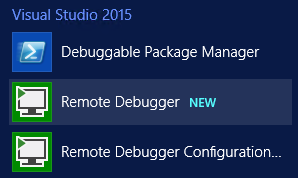
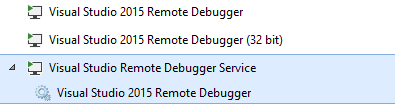
For a successful setup you should see the following Remote Debugger applications installed on the target machine
Setup / Configure VS2015 Remote Debugger on the target machine
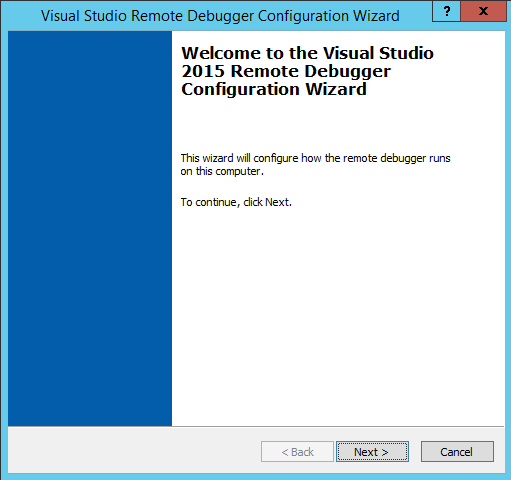
Click on VS2015 Remote Debugger Configuration Wizard. You'll be prompted to enter your admin credentials or you may be prompted to run it with elevated privileges. Once you have successfully entered credentials or clicked on yes, it should start the configuration wizard. Click on Next to continue.
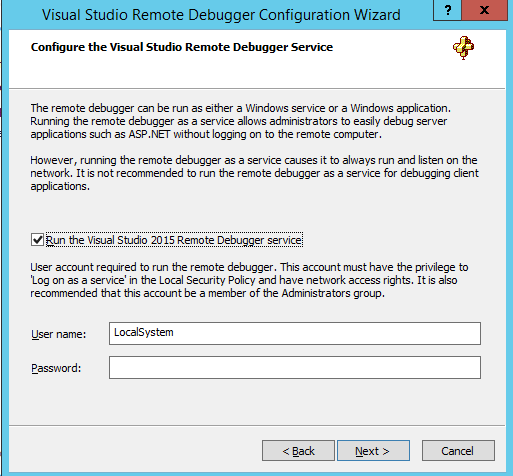
Select Run the Visual Studio 2015 Remote Debugger service and click on Next. You don't need to enter password for LocalSystem account. You may choose to run it under different credentials like faceless service account that has Administrative access to the target machine.
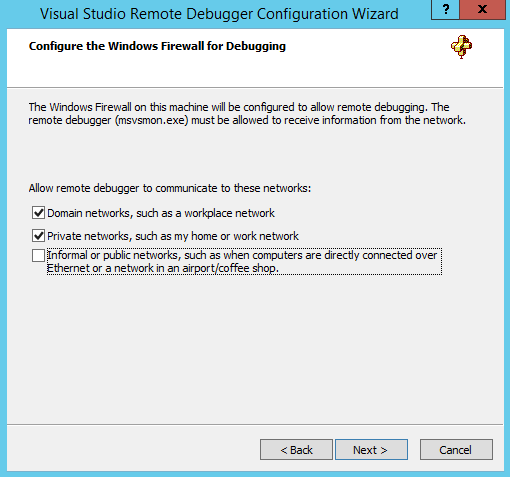
In the next screen, you may want to uncheck 3rd option if the machine is inside a corporate domain and if you do not plan to connect to the machine directly via Ethernet cable. Here are notes from help file:
By default, the Remote Debugger Configuration dialog configures the Windows Firewall rule to apply to all network profiles (Domain, Private and Informal/Public). The Informal/Public configuration enables the scenario when the Visual Studio computer is directly connected to a target device via an Ethernet cable. The Visual Studio remote debugger uses authentication and encryption to maintain security in this scenario.
You can disable one or more network profiles by clearing the appropriate checkboxes (Domain/Private/Informal). However, if all currently active profiles are unchecked, the configuration dialog disables the 'Configure remote debugging' button. For example, if your computer is connected to a single network, and this network is an Informal network, then unchecking the Informal checkbox will disable the Configure button.
Click on Next to continue.
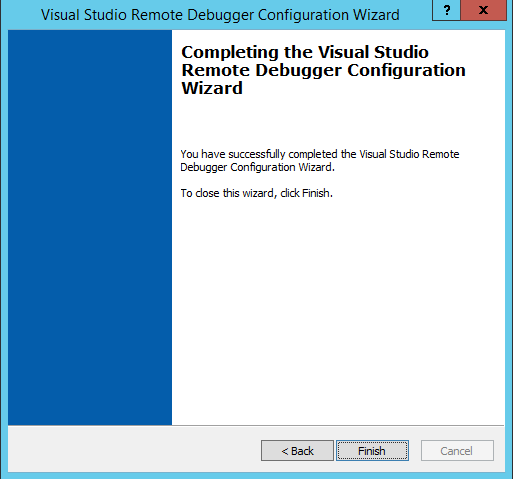
Click on Finish to complete the configuration!
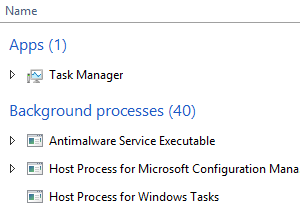
Now open the task manager to confirm that the remote debugger is ready for me to use and start debugging applications / processes. I do not have any foreground processes running except Task Manager. The following processes will be listed in the background processes in case of windows 8 / 2008+ OS. I'm using 64-bit OS so I see 2 instances of Visual Studio 2015 Remote Debugger (32-bit and 64-bit). You'll see only 1 instance of Visual Studio 2015 Remote Debugger in case or x86 or ARM architectures.
Connecting VS2015 to VS2015 Remote Debugger on Target Machine
Start Internet Explorer process on the target machine where you just now installed VS2015 Remote Debugger. I navigated to msn.com, you can navigate to site of your choice or the web site you want to debug.
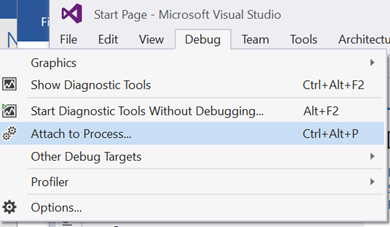
On VS2015 Machine, open VS2015. Click on Debug à Attach to Process…
On the Attach to Process window, specify target machine name in the Qualifier textbox. Or click on Find… button to find the machine in the domain. I'm connecting to my test machine named ContosoDev2.
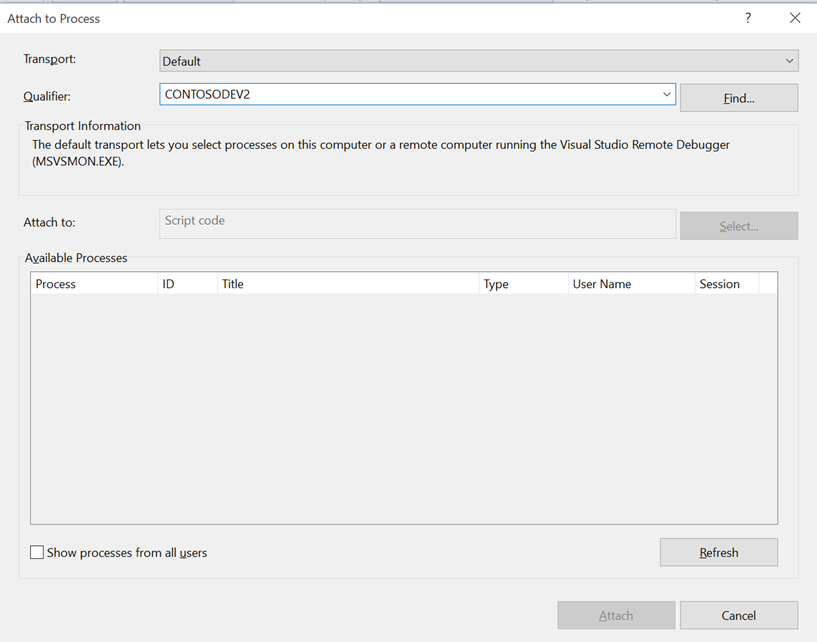
By default, the list will not be refreshed so click on Refresh button to see the list of running processes. You may want to select Show processes from all users if you need to debug process launched by another user.
Note:
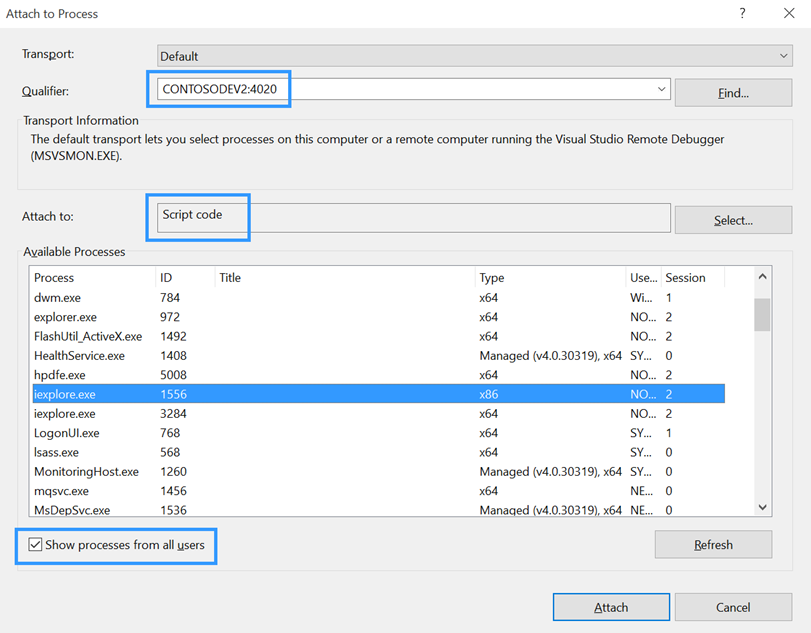
- If you configured Remote Debugger to run under LocalSystem account (or accepted default settings) then, you'll have to select Show processes from all users option to view your processes. As it will only list processes running under SYSTEM account in all sessions.
- The Qualifier may change from ContosoDev2 to Contosodev2:4020.
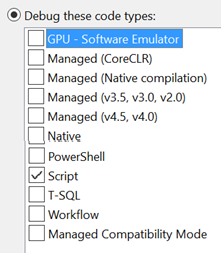
- Make sure you select Script code as debugging option or Attach to as shown in the screenshot.
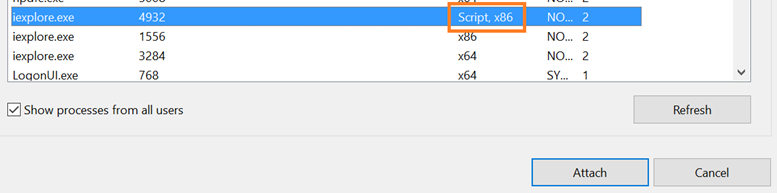
Select the target process and click on Attach button. Make sure Script is displayed next to the target process as shown.
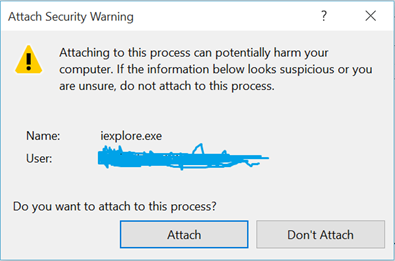
Visual Studio warns you against potential security compromise that may happen when you attach to a remote process. If you know the target process and site it has navigated to click on Attach to continue.
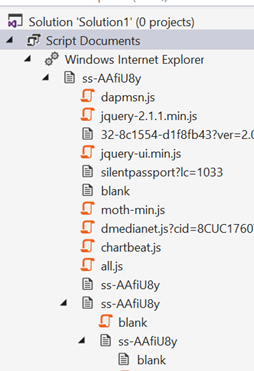
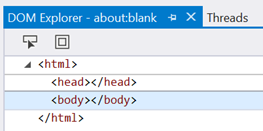
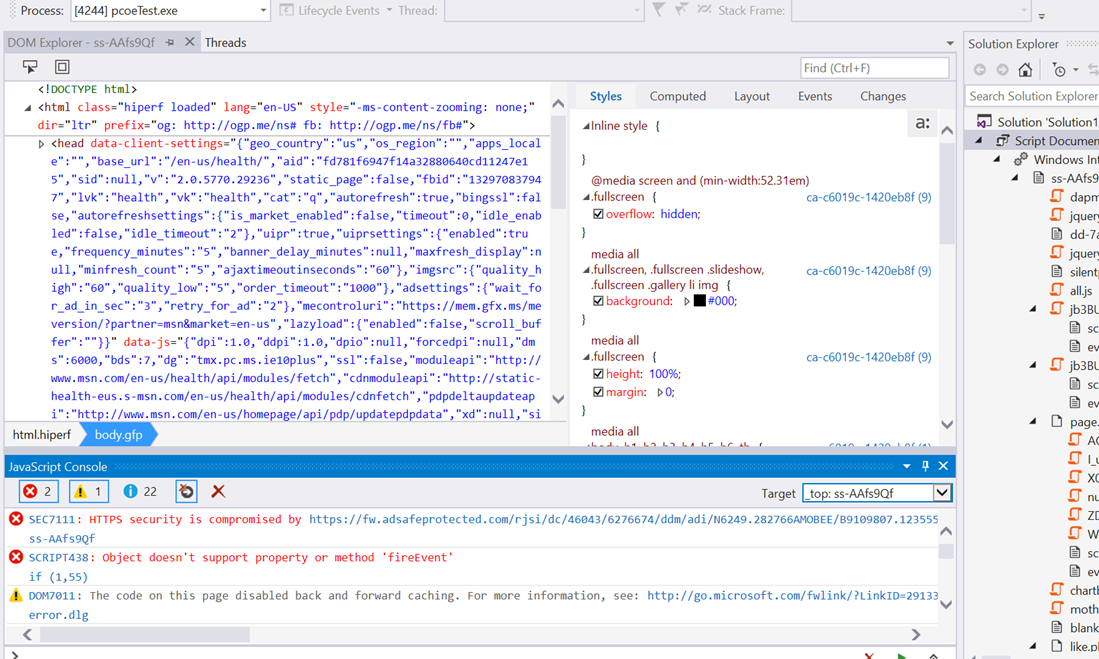
After the connection is successful, you should see JavaScript files in the VS2015 Solution Explorer and DOM Explorer as well.
Now, I can continue debugging as normal – that's all you have to get it to work.

Debugging and Troubleshooting Common Questions (FAQs)
I'm not able to see or find any machines.
Make sure firewall is not blocking any connections. You may want to use tools like TCPView to identify if port is getting blocked or not. Please refer to Firewall Configuration section or help file or the Remote Debugger on target machine to find more information.
Behind the scenes, VS2015 Remote Debugger installation configures firewall rules to allow remote debugging. VS2015 Remote Debugger by default will use TCP port 4020. You may use different port if required. Make sure msvsmon.exe is not blocked on port 4020 or the port you select by firewall or security suites/software. For x86 process on x64 OS make sure port 4021 is open as well.
I do not see any threads in the VS2015 Threads window when I debug IE process. Or I'm not able to debug IE / target process.
Make sure you connect to correct Internet Explorer instance. IE starts two processes when you start IE for the first time – a frame process and a tab process. You should attach debugger to tab process and not the frame process. Read more about LCIE here.
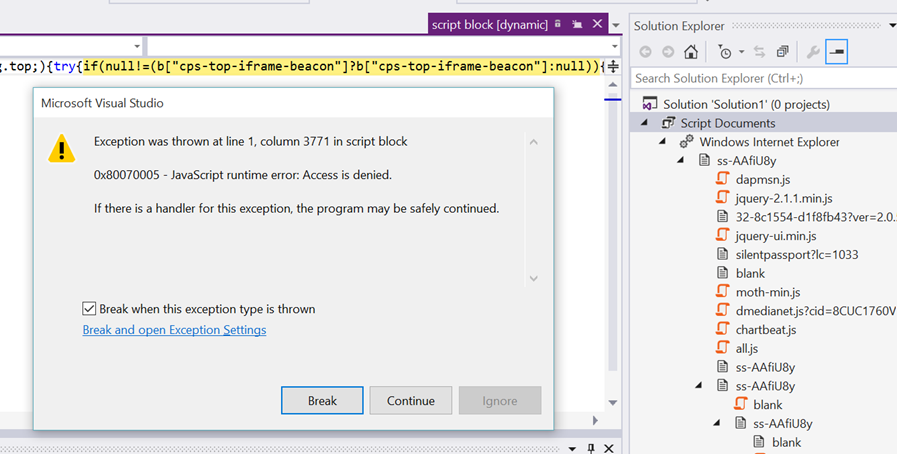
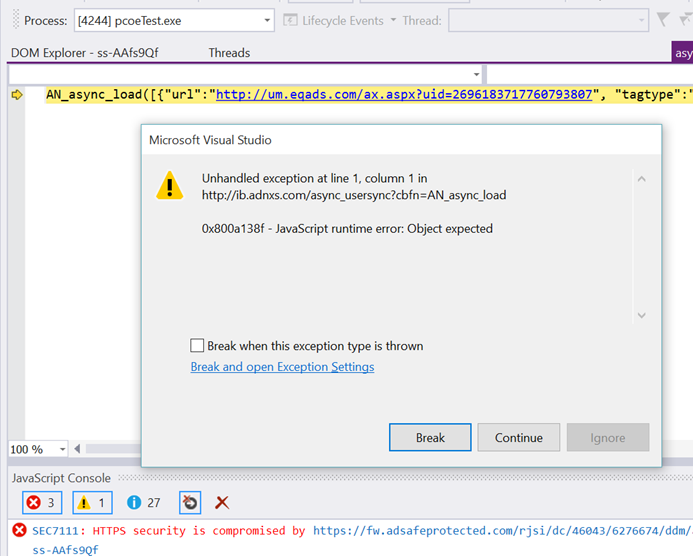
I still do not see any threads in the VS2015 Threads window when I connect to correct IE tab process.
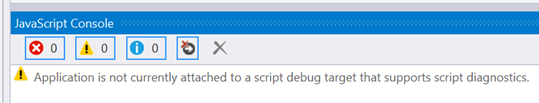
Check Visual Studio JavaScript Console window. Do you see any errors like this?
If you do, then you need to configure Internet Explorer on the target machine to allow script debugging. To resolve this issue,
Open Internet Explorer process (target machine)
Click on
 Tools à Internet Options and select Advanced tab
In the advanced tab, uncheck the following two options under Browsing section
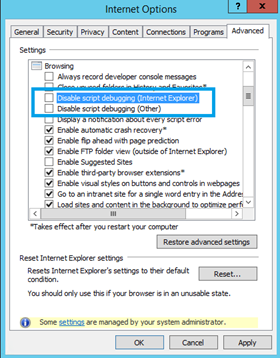
Click OK or Apply to make changes.
Detach the debugger or stop debugging and try to attach the debugger again.
I still do not see any threads when I connect to correct IE tab process. Even though I unchecked the above two options.
Make sure you restart the IE process or start a new IE process. Attach VS2015 to the new process as these changes require you to enable script debugging.
Can I run multiple instances of remote debugger? Say one for each user?
Multiple instances of the remote debugger may be run on the same computer. This is required if there is a single server shared by multiple users, and each user wants to run their own instance of the remote debugger to debug their own processes.
Each instance of the remote debugger must run on its own TCP/IP port number. The remote debugger can be configured to listen at a specific port number from Tools->Options in the remote debugger, or from the command line using /port:<value>.
To connect to a specific instance of the remote debugger, include the port number along with the computer name in the 'remote machine'/'qualifier' setting (ex: MyServer:1234 to connect to port 1234 on MyServer). Source help file.
Can I debug a remote service, say Web Service running as IIS
Yes, You can run the remote debugger as either a Windows service or a Windows application. Running the remote debugger as a service allows you to easily debug server applications such as ASP.NET without logging onto the remote computer.
Running the remote debugger as a service causes it to always run and listen on the network. It is not recommended to run the remote debugger as a service for debugging client applications.
With the Visual Studio 2015 Remote Debug Configuration wizard, you can control the username and password that the remote debugger service runs under. When the remote debugger is running as a service, the following requirements must be met to debug remotely:
- The user must be a member of the Administrators group to allow debugging of any process.
- The user must be granted the 'Log on as a service' privilege. This can be done with the 'Local Security Policy' administrative tool.
The default user for the remote debugger service is 'LocalSystem.'
The name of the service is 'Visual Studio 2015 Remote Debugger'. It is recommended that you only control the service through the Visual Studio 2015 Remote Debugger Configuration wizard. If necessary, it can be controlled through the computer management administration tool, or on the command line -- 'net stop msvsmon140' or 'net start msvsmon140'. Source help file.
Can I debug code other than JavaScript like .NET or T-SQL?
Yes, you can debug any code that VS2015 supports for debugging. Managed (.NET, CLR), Native, GPU, PowerShell, Script, T-SQL, Workflow etc. Or you can let VS2015 automatically decide the code type!
Do I need to install anything on target machine?
What is the pre-requisite for VS2015 Remote Debugger?
What does VS2015 Remote debugger internally use?
Remote debugging is implemented using the Windows Web Services API. The Windows Web Services API is a building block that applications, such as the remote debugger, can use to communicate over the network. This API is already included in Windows 7, Windows Server 2008 R2 and later operating systems. For Windows Server 2008 (pre-R2), the Visual Studio Remote Tools setup will automatically install the API.
Can I start and stop VS2015 Debugger using command line?
Yes. You may have a requirement to start and stop debugger only on demand say on certain QA machines. You can configure and manage VS2015 Remote Debugger using command line. Refer to help file for more information.
Can I start process under debugger?
Configure Visual Studio to connect to the remote debugger
- If you want to launch a C#/VB project: Open properties for your project (right click in solution explorer), and on the Debug tab, check the option to use a remote machine.
- If you want to launch a C++ project: Open properties for your project (right click in solution explorer), and on the Debugger menu, change the Debugger to Launch value to Remote Windows Debugger. Set the Remote Command property to path that the remote computer should use.
- To attach to an already running process: Start the Attach to Process dialog from the Tools or Debug menu, and enter the remote computer name into the Qualifier edit box.
- To debug a web site: Open the web site from a remote file share, and then configure the Custom Web Server property to the web server's URL (exe: https://myserver).
- To launch an executable without a project: Create a debugger project by opening the executable as a project (File->Open Project) and entering the path to the executable that you want to debug (ex: \\MyTestComputer\c$\MyTest.exe). Then open project properties and change the Connection property. Also adjust the Executable property to the path that the remote computer should use.
Debugging Web browser control (WebOC) JavaScript code
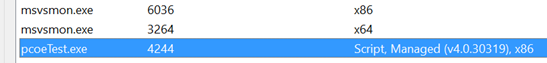
You can not only debug Internet explorer but also an application (.NET / C++ | managed / native) hosting WebOC or Web Browser Control as well. To do so simply start application on the target machine. In my case the name of .NET application hosting WebOC is PCOETest.exe. Open VS2015 and follow 2nd step onwards and attach to your target application instead of IE (iexplore.exe) process.
You'll be able to debug as you'd debug a local managed application hosting web browser control
Firewall Configurations
- The communication between VS2015 debugger and target machine is always authenticated and subsequent calls are also encrypted.
- To allow remote debugging, any firewalls between the Visual Studio computer and the remote debugger must be configured so that the remote debugger (msvsmon.exe) will be able to receive data sent from Visual Studio.
- The remote debugger will automatically configure the Windows Firewall in most cases.
- However, if it doesn't then please open port 4020 (64-bit process on x64 OS & 32-bit process on x86 OS) and port 4021 (32-bit process on x86 OS).
- Remote Debugger Configuration dialog can be used to configure the Windows Firewall rule to apply to all network profiles (Domain, Private and Informal/Public).
- Informal/Public: Use when you want to connect VS debugger directly to the target device via an Ethernet cable.
- Note: The communication is secure as in previous cases because VS remote debugger uses authentication and encryption.
In the next blog may be I'll include sample pages running in different processes that we'll debug using VS2015 Remote Debugger.