Systems Manageability Part Five: Monitoring
by kishi on June 21, 2007 12:16pm
Background: This is Part 5, continuation of the series of 8 blogs I’m doing on Systems Manageability. In this specific blog, I will focus on and explain the third part of the “ontology” which is “Monitoring”
Level-Set – Monitoring: Monitoring and other data collection tools are an essential component of any management strategy. The proper collection and organization of host data allows for manual and sometimes automated reactive corrective measures. This section outlines many of the open source and free software monitoring tools available on the Linux platform. Much of the analysis in this section is focused on the inner workings of these tools as data collection systems, rather than feature comparisons between the various monitoring applications. The WBEM/CIM overview has been placed in this section due to its basis as a data collection and management system, even though its use is not limited the confines of this category.
I.WBEM/CIM: The following section includes an overview of the WBEM initiative and the open-source CIM implementations that exist today. The Distributed Management Task Force (DMTF) classifies WBEM (Web Based Enterprise Management) as the following:
“[WBEM is] a set of management and Internet standard technologies developed to unify the management of distributed computing environments. WBEM provides the ability for the industry to deliver a well-integrated set of standard-based management tools, facilitating the exchange of data across otherwise disparate technologies and platforms.”
Core components and industry standards used in WBEM include CIM, CIM-XML, CIM Query Language, SLP (Service LocationProtocol, for WBEM Discovery) and WBEM URI (Universal Resource Identifier) mapping. The DMTF has also developed a WBEM Management profile template for the purpose of systems manageability. WBEM has been designed to be compatible with all the major existing management protocols, including SNMP, DMI, and CMIP. There are several open source implementations of WBEM including OpenWBEM, WBEM Services, OpenPegasus and SBLIM. These are discussed in more detail below. Additionally, there are both client and server implementations available for the WBEM standard:
-
- WBEM clients include PyWBEM, an open-source WBEM library written in Python, and the Purgos open-source management client for Windows written in C++.
- WBEM server implementations include OpenPegasus and OpenWBEM, an open-source client and server written in C++ (Novell has adopted this and added it to SLES9/10).
The following is an explanation of CIM, or Common Information Model, from the DMTF documentation:
“provides a common definition of management information for systems, networks, applications and services, and allows for vendor extensions. CIM’s common definitions enable vendors to exchange semantically rich management information between systems throughout the network. It is a conceptual information model for describing management that is not bound to a particular implementation. This allows for the interchange of management information between management systems and applications. This can be either "agent to manager" or "manager to manager" communications that provides for Distributed System Management.”
CIM includes two components; a specification and a Schema.
- CIM Specification: This describes the language, naming, Meta Schema and mapping techniques to other management models such as SNMP MIBs, and DMTF MIFs etc. The Meta Schema is a formal definition of the model. It defines the terms used to express the model and their usage and semantics. The elements of the Meta Schema are Classes, Properties, and Methods. The Meta Schema also supports Indications and Associations as types of Classes and References as types of Properties. Essentially, the CIM specification
- CIM Schema: This provides the actual model descriptions. The CIM Schema supplies a set of classes with properties and associations that provide a well-understood conceptual framework within which it is possible to organize the available information about the managed environment. The CIM Schema itself is structured into three distinct layers:
-
- The Core Schema is an information model that captures notions that are applicable to all areas of management.
- Common Schemas are information models that capture notions that are common to particular management areas, but independent of a particular technology or implementation. The common areas are systems, devices, networks, applications, metrics, databases, the physical environment, event definition and handling, management of a CIM infrastructure (the Interoperability Model), users and security, policy and trouble ticketing/ knowledge exchange (the Support Model). These models define classes addressing each of the management areas in a vendor-neutral manner.
- Extension Schemas represent organizational or vendor-specific extensions of the Common Schema. These schemas can be specific to environments, such as operating systems (for example, UNIX® or Microsoft Windows®). Extension Schema fall into two categories, Technology-Specific areas such UNIX98 or Product-Specific areas that are unique to a particular product such as Windows.
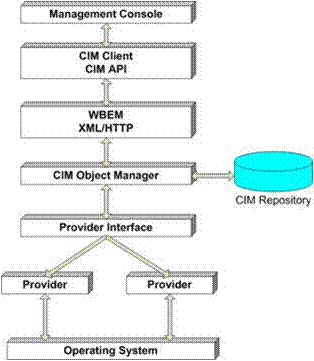
WBEM (CIM) Architecture Diagram
OpenPegasus:
OpenPegasus is an open-source implementation of the DMTF CIM and WBEM standards being driven under the auspices of The Open Group. OpenPegasus is open source and is licensed under the MIT open-source license. The distribution is available via CVS, and as snapshot images in tar, zip, and (self-extracting) exe file formats on the OpenPegasus web site. Based on documentation posted on the site, simply put, Pegasus is an open-source CIM Server for DMTF CIM objects. It is written in C++ and includes the Object manager (CIMOM), a set of defined interfaces, an implementation of the CIM Operations over HTTP operations and their cimxml HTTP encodings, and Interface libraries for both clients and providers. It is maintained to be compliant with the DMTF CIM and WBEM specifications with exceptions noted in the documentation. It is designed to be portable and modular. It is coded in C++ and translates the object concepts of the CIM objects into a programming model. Pegasus is designed to be inherently portable and builds and runs today on most versions of UNIX(R), Linux, and Windows. OpenPegasus includes the following components:
-
- A DMTF compliant CIM Server that processes CIM operations, CIM Indications, and includes class and instance repositories and interfaces for creating CIM Providers and CIM Clients.
- Provider interfaces so that providers may be build in multiple languages (i.e. C++, C, Java).
- A number of CIM Providers.
- A MOF compiler.
- A number of CIM Clients to provide usage examples, CIM Server test functions, and administrative functions
OpenWBEM On SLES10:
OpenWBEM is included in SUSE Linux Enterprise Server 9 and 10, allowing any WBEM enabled management console to access configuration information on the system. A CIM schema and a MOF compiler are also included as packages in SLES9 and 10, which can be used to create and import the schema.
## Create the namespace called /root/cimv2
SLES10:/etc/openwbem # owcreatenamespace -n /root/cimv2
Creating namespace (/root/cimv2)
## Import the CIM schema.
SLES10:/etc/openwbem # owmofc /usr/share/mof/cimv2.12/cimv212.mof
[ ... Lots of Output ... ]
Compilation finished. 0 errors occurred.
Compiling and Importing the CIM Schema
## Start the OpenWBEM Daemon.
SLES10:~ # /etc/init.d/owcimomd start
Using common server certificate /etc/ssl/servercerts/servercert.pem
Starting the OpenWBEM CIMOM Daemon done
## Check the status of the OpenWBEM service.
SLES10:~ # /etc/init.d/owcimomd status
Checking for service OpenWBEM CIMOM Daemon running
Starting the OpenWBEM Service on SLES10
II. NAGIOS: Nagios is a system monitoring application designed to monitor remote hosts and applications over a network. The application provides a web-based graphical display that allows one to view the status of nodes and particular applications running on the nodes. The following is an excerpt from the Nagios documentation listing some of Nagios’ feature set: Some of the many features of Nagios include:
-
- Monitoring of network services (SMTP, POP3, HTTP, NNTP, PING, etc.)
- Monitoring of host resources (processor load, disk usage, etc.)
- Simple plugin design that allows users to easily develop their own service checks
- Parallelized service checks
- Ability to define network host hierarchy using "parent" hosts, allowing detection of and distinction between hosts that are down and those that are unreachable
- Contact notifications when service or host problems occur and get resolved (via email, pager, or user-defined method)
- Ability to define event handlers to be run during service or host events for proactive problem resolution
- Automatic log file rotation
- Support for implementing redundant monitoring hosts
- Optional web interface for viewing current network status, notification and problem history, log file, etc.
Nagios can poll servers and obtain data in a number of different ways. The most straight-forward method is to connect to a remote system directly and test to see if the host is available or if a particular service is running. Data internal to the host, such as free memory or processor usage, however, must be gathered using the Nagios agent, SNMP, another custom script or program or a Nagios plug-in called check_by_ssh - which is a standard plug-in designed to run a command on a remote machine and collect the output. The configuration of Nagios is done entirely via text-based configuration files. Hosts and other resources are defined inblocks, which can also inherit information from other pre-defined blocks, making complex configurations possible and more manageable. There are several third-party applications available that provide a web or other GUI interface to assist one with configuring Nagios, but these were not tested for this project. The following configuration block defines a generic host template called “linux-server”. Many of the configuration values such as “24x7” and “workhours” are actually defined in other configuration blocks within the Nagios configuration. This allows administrators to define custom names to a specific time period, such as “workhours”, and use that definition in other parts of the configuration.
define host {
name linux-server
use generic-host
check_period 24x7
max_check_attempts 10
check_command check-host-alive
notification_period workhours
notification_interval 120
notification_options d,u,r
contact_groups admins
register 0
}
Nagios Host Definition Template
Individual hosts are defined in configuration blocks. Below is a sample configuration for an individual host called management. Notice the use statement is inheriting other definitions from the previously defined generic template mentioned above called “linux-server”.
define host {
use linux-server ;Name of host template to use.
host_name management
alias Management Server
address 10.197.173.100
}
Finally, hosts may be organized into logical groups for easier management. The following is a hostgroup that defines a group that includes five hosts.
define hostgroup {
hostgroup_name test
alias Test Servers
members localhost,management,www,rhel4-production2,network
}
Nagios is distributed with a wide assortment of plug-ins that can be used to obtain data or check a particular service. Plug-ins are distributed as a separate package which must be installed with both the server and the agent if an agent is to be used. The Nagios plug-ins are simply stand-alone executable programs, each of which can perform a particular task and return a result code for each service or subsystem being tested. Since plug-ins are individual scripts or binary programs, they often will accept different arguments to change their behavior and what information they return. The command usage of each plug-in must be defined individually within the configuration files using the define command syntax. Some plug-ins can accept multiple options which can be customized when writing the configuration for a particular system. The define command definition provides a sort of usage template so that Nagios will know how to run the command later. Luckily for new users, the default sample configuration files already provide accurate definitions for the default plug-ins. Once one is familiar with how commands are defined, however, new commands or custom scripts can also be defined here as well.
NRPE: is the Nagios Remote Plugin Executor that is installed on a remote host. It is designed simply to execute Nagios plugins on behalf of the Nagios server and return the results. The same plugins that are installed on the server must then be installed on the remote host for NRPE to utilize. A new plug-in called check_nrpe is also distributed with the NRPE agent and is used to query the NRPE daemon from the Nagios server. NRPE utilizes a rudimentary access control system to assure that only particular Nagios hosts will be allowed to contact the NRPE client. A configuration directive such as the following within NRPE’s configuration file will only allow communication with a particular host:
allows_hosts=10.197.173.100
It is possible to configure NRPE run nearly any command with any arguments, although one is warned against doing this in the documentation. By default, NRPE will only run specific commands and their arguments as specified in its own configuration file (located on the host itself). Meaning that the Nagios server can tell NRPE to execute only specific commands specified in the remote host’s /etc/nrpe.cfg file, but the server may not pass arbitrary commands or plug-in arguments for the agent to execute. Below is a sample NRPE configuration. The specific commands (plug-ins) and arguments must be specified here. The Nagios server can then request NRPE to execute one or more of these commands and return the results:
command[check_users]=/usr/local/nagios/libexec/check_users –w 5 –c 10
command[check_load]=/usr/local/nagios/libexec/check_load –w 15,10,5 –c 30,25,20
command[check_disk_root]=/usr/local/nagios/libexec/check_disk –w 20 –c 10 –p /dev/sda1
command[check_zombie_procs]=/usr/local/nagios/libexec/check_procs –w 5 –c 10 –s Z
command[check_total_procs]=/usr/local/nagios/libexec/check_procs –w 150 –c 200
By default NRPE utilizes SSL communications between itself and the Nagios server. The SSL parameters are generated at compile time and stored in the C header file called dh.h within the NRPE source tree. This header file is then used to compile the NRPE daemon and the check_nrpe plugin. This means that both the NRPE daemon and the check_nrpe plugin must be compiled using the same parameters (typically from the same source tree) if one wishes to utilize SSL communications.
III. Hyperic: Hyperic HQ is a Java-based monitoring application consisting of a central monitoring server and one or more remote agents to report node status information to the server. Hyperic HQ is supported on a wide array of platforms, including Linux, Solaris, Windows, HP-UX, AIX, Mac OS X and FreeBSD. Hyperic distributes two versions of its software;
- An open source version licensed under the GNU GPL
- and a commercial version called HQ Enterprise which includes additional components and functionality.
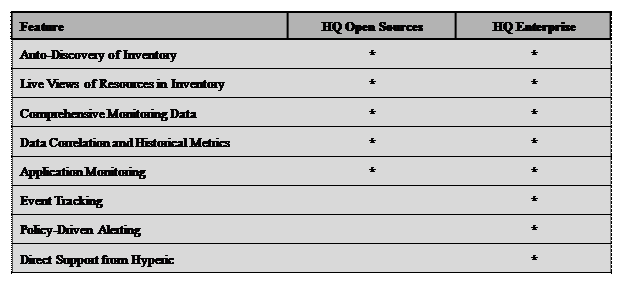
HQ Open Source and HQ Enterprise Feature Set Comparison
Note: As of HQ 3.0 thefeature-set distribution between the Open-Source and Enterprise versions has changed. Please see https://www.vmware.com/tryvmware/?p=hyperic&lp=1 for more details.
Hyperic Installation and Configuration: Hyperic HQ aims to be quick to install and relatively easy to configure. The installation is performed via the command-line, and will prompt the administrator for all the information (administrator password, database information, etc) it will need to successfully run. Upgrading can also be done relatively easily by simply running the installer with the –upgrade option. Hyperic HQ provides a web interface to deliver monitoring alerts and status information to the end-user. However, unlike other monitoring applications the web-interface is also used as the primary configuration interface for the application. All node and agent details, metric options and alerts may be configured directly over the web interface. The monitoring agent is installed in a similar manner as the server. Because all agent configuration is done via the web interface on the server, the only information the agent installation script needs is login information for the server, the preferred path on the node to which it should install the agent files and various other pieces of information such as the port numbers on which the server and agent will be running. Once the agent successfully registers itself with the server, the administrator can then log in to the web interface and import the new system into its list of monitored hosts. The Hyperic HQ server utilizes the open-source PostgreSQL database application to store configuration and monitoring data. PostgreSQL comes prepackaged with the Hyperic HQ software, and can be installed and configured automatically by the installation system. One may also choose to use an existing PostgreSQL or Oracle database server if one exists. The installation system would then prompt the administrator for information about the database so that Hyperic HQ may log in and store its data. By default, Hyperic HQ stores its authentication information within this database as well, but may also be configured to utilize and external LDAP server if one is available.
Auto-Discovery: A unique feature of the Hyperic HQ monitoring solution is its ability to automatically locate and monitor services and daemons running on the remote node. Once the agent is installed on the remote node it can then scan for a variety of known services and add it to the hosts inventory. Once added to the inventory, metrics and alerts can be configured to monitor that particular service. Hyperic HQ supports two scanning options, auto-scan and file-scan. Agents run an auto-scan periodically by default which scans the process list for known server types. A more comprehensive scan called a file-scan can actually search through the file system on the remote node and locate known applications. Because it requires more time to run and is more resource intensive, this type of scan must be scheduled and configured manually by the administrator.
Alerts and Notifications: Hyperic HQ supports the configuration of alerts based on any metric for any particular resource (such as the host itself) or service running on the host. For example, an alert can be triggered when the Availability metric for a host falls changes at all, or falls below a predefined value. When an alert is triggered an email can be sent to a predefined email address. Depending on the priority of the alert, a message will also be posted to the Dashboard, the Hyperic HQ administration front page. The HQ Open Source version lacks many of the more advanced notification options that are available in the Enterprise version. HQ Enterprise also supports the concept of Recovery Alerts, which are alerts that can be configured to cancel and reset triggered alerts. When an alert is triggered in the Open Source version, the alert will continue to be triggered until the problem is fixed or the alert is disabled. Recovery Alerts allow an administrator to automate the process of disabling an active alert, and then re-enabling the alert when the problem is corrected. HQ Enterprise also supports the option of sending SNMP traps as a notification option.
Hyperic HQ Plugins: Hyperic HQ plugins are distributed as .jar or .xml files that are deployed on the server and the agent. Plugins can be developed to enhance the collection of metrics from certain applications or services, locate and inventory new services and control actions to control specific resources. The Hyperic website provides comprehensive documentation on plugin development. Developing and adding a new plugin tends to be a more complex process compared to Nagios or other monitoring applications. The framework provided by Hyperic HQ, however, provides advanced APIs from which the plugins can query information on multiple platforms. On Windows, for example, Hyperic HQ includes classes which a plugin may use to access Windows specific data and functions. These functions can provide access to performance information, registry data, event log information and the Service Control Manager (SCM). Hyperic HQ also provides support for simple script-based plugins to gather particular metrics. Even individual scripts or Nagios plugins may be imported and configured for use by the Hyperic HQ server and agents.
SIGAR – System Information Gatherer And Reporter: SIGAR is the primary data collection component of the Hyperic HQ agent. The software is designed to collect system and process information from a number of platforms - including Linux, Windows, Solaris, AIX, HP-UX, FreeBSD and Mac OSX. SIGAR is written in C, but Hyperic provides C, C#, Java and Perl APIs which one may use to to integrate SIGAR into their applications. The SIGAR component is licensed under the GNU GPL, and is distributed separately from the Hyperic monitoring agent for potential use in third-party applications. The Sigar API provides a portable interface for gathering system information such as:
-
- System memory, swap, cpu, load average, uptime, logins
- Per-process memory, cpu, credential info, state, arguments, environment, open files
- File system detection and metrics
- Network interface detection, configuration info and metrics
- Network route and connection tables
user@linux:~/hyperic-sigar-1.3.0.0> java -jar sigar-bin/lib/sigar.jar
Loaded rc file: /home/user/hyperic-sigar-1.3.0.0/sigar-bin/lib/.sigar_shellrc
sigar> help
Available commands:
alias - Create alias command
cpuinfo - Display cpu information
df - Report filesystem disk space usage
du - Display usage for a directory recursively
free - Display information about free and used memory
get - Get system properties
help - Gives help on shell commands
ifconfig - Network interface information
iostat - Report filesystem disk i/o
kill - Send signal to a process
mps - Show multi process status
netinfo - Display network info
netstat - Display network connections
pargs - Show process command line arguments
penv - Show process environment
pfile - Display process file info
pinfo - Display all process info
pmodules - Display process module info
ps - Show process status
ptql - Run process table query
quit - Terminate the shell
route - Kernel IP routing table
set - Set system properties
sleep - Delay execution for the a number of seconds
source - Read a file, executing the contents
sysinfo - Display system information
test - Run sigar tests
time - Time command
ulimit - Display system resource limits
uptime - Display how long the system has been running
version - Display sigar and system version info
who - Show who is logged on
sigar>
Example SIGAR usage from the command-line.
And that does it for the “Monitoring” section. There are so many other tools we got a chance to play with like Monit, Argus, OProfile etc. but am running out of space …… As always, please let us know if you found the above mentioned useful and any comments/feedback you may have. Thank you for tuning into Port25.