Track down LDAPs clients on a domain controller
You probably wonder why that could be a big deal. Usually clients not doing LDAPs are the ones we worry about (for security reasons, simple binds over LDAP aren't your best friends). Yet I have been facing situations where we need to identify who is doing LDAPs. Here is the scenario I have been seeing a couple of times:
- The certificate of one the certification authorities used for the LDAPs certificates is about to expire.
- The certification authority is decommissioned and replaced by another one.
- Some non Windows machines are not able to get the new certificate automatically.
- Some applications running on Windows do not use the available Windows API to do the certificate related job and rely on importing a certificate in an application store in order to function.
What do we have to track them down by default?
We can enable the SChannel logging. It will tell us that the TLS handshake went well but it does not tell us about who is doing this handshake
We can enable the 16 LDAP Interface Events. It will generate an event for each of the LDAP or LDAPs binds and searches but nothing about the sources of the calls.
We can enable the security audit and parse the incoming successful connections, and crosscheck that information with LDAP events... It's a pain and it does not even tell us if it is LDAP or LDAPs.
Since Windows Server 2008 we have the possibility to run a network capture out of the box with netsh. But there is no filter and it might impact the overall performance of the server. Moreover, the server in our case is a domain controller. So we'd better be sure we are not bringing it down.
What can we do?
One possibility (and this is the one explored in this post) is to use Network Monitor to run a capture with a custom configuration to reduce the performance impact. What are the performance issues we can have?
- it uses CPU cycles to filter the capture
- it uses CPU cycles to parse the capture in real time
- it uses memory to put the stream from the wire to the buffer
- it uses disk IO to write what we capture into a file
To address these, we will:
- create a custom parser to minimize the memory
- run it in command line using nmcap and disabling some options to reduce the footprint
- limit the capture to the first few bytes to reduce the disk and memory usage
Create a custom parser (taken from https://blogs.technet.com/b/netmon/archive/2010/01/04/capturing-a-trace-a-boot-up.aspx)
Create a folder like C:\LDAPs
In that folder, create a text file called sparser.npl with the exact following content:
| UnsignedNumber Stuff(n){ Size = n;}Protocol Frame{} |
This parser is the simplest ever. Basically it does not do any sort of analysis, instead it just enables us to make filter based on the presence of a specific group of bytes at a specific offset of the frame. To make Netmon use this parser, simply run the following command:
| "C:\Program Files\Microsoft Network Monitor 3\nmcap.exe" /SetNPLPath C:\LDAPs |
In case of success you should see the following output:
| Network Monitor Command Line Capture (nmcap) 3.4.2350.0Compiling Include Path: C:\LDAPs[INFO] Successfully loaded 'C:\LDAPs\sparser.npl' file. (0x83006031)[INFO] sparser.npb:001.000 Successfully serialized NPL parser 'C:\LDAPs\sparser.npb. (0x83008005)Successfully compiled the provided include path. Setting active profile. |
If not, review the syntax of your file sparser.npl or maybe the path you are specifying.
Run nmcap with some custom parameters
Now that we have our custom parser, we cannot filter the incoming traffic based on the classic syntax. The only filter we can do is with: Stuff(FrameData, <offset>, <length>) . So if we want to capture only the LDAPs traffic, it means we need to know what is the position of the port used by LDAPs in the FrameData. What, you don't know your TCP/IP offsets by heart? Well, who does, maybe my network professor back in school day? (well I'm actually sure he does) Let's open a network trace with some LDAPs traffic and look what we have and in which position (offset).
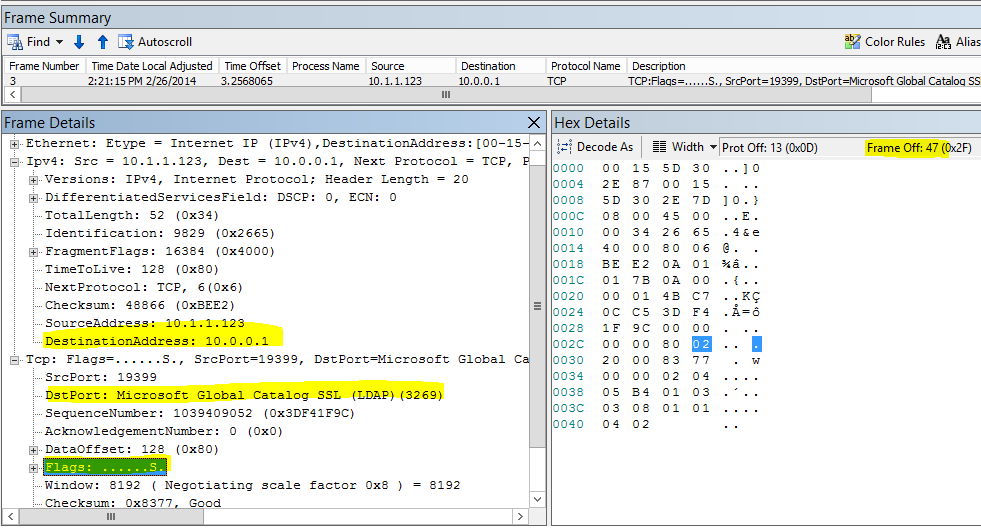
It's a TCP Syn message. No need to capture further. We actually do not really care if the domain controller will send back a SYN ACK or not, we are just interested in the incoming traffic. The offset information we need are:
- Offset 30: DestinationAddress (4 bytes)
- Offset 36: DstPort (2 bytes)
- Offset 47: TCPFlags (1 byte)
So if we want to catch all incoming LDAPs connections in our domain controllers we need:
- Offset 30 = IP address of our domain controller to catch the incoming traffic
In my lab my domain controller has the IPv4 address 10.0.0.1 so the value to check for is 0x0a000001 - Offset 36 = 636 or 3269
636 is 0x027c and 3269 is 0x0cc5 - Offser 47 = SYN
Flags is 0x02
Here comes our optimized filter: ( Stuff( FrameData, 30, 4 ) == 0x0a000001 and Stuff( FrameData, 47, 1 ) == 0x02 and ( Stuff( FrameData, 36, 2 ) == 0x027c or Stuff( FrameData, 36, 2 ) == 0x0cc5) )
What else we will use:
- /DisableConversations
We don't want to get that information so we tell nmcap to not try to build the conversation, this enhance the capture - /MaxFrameLength
No need to get all the frame, we just need the source IP, therefore the data after the late offset we need can be truncated, in our case just the first 48 bytes, no more - /File
In order to make sure we will not have a huge file hard to manipulate, we specify the format .chn followed by :500M. This will create a cap file of 500 Mb and when the file is full it will automatically create another file and so on...
Here is the final command:
| "C:\Program Files\Microsoft Network Monitor 3\nmcap.exe" /Network * /DisableConversations /Capture "( Stuff( FrameData, 30, 4 ) == 0x0a000001 and Stuff( FrameData, 47, 1 ) == 0x02 and ( Stuff( FrameData, 36, 2 ) == 0x027c or Stuff( FrameData, 36, 2 ) == 0x0cc5) )" /File C:\LDAPs\MyTraffic.chn:500M /MaxFrameLength 48 |
And here is the output:
| Network Monitor Command Line Capture (nmcap) 3.4.2350.0 Loading Parsers ... [INFO] sparser.npb:001.000 Successfully unserialized NPL parser 'C:\LDAPs\sparser.npb. (0x83008006) Saving info to: C:\LDAPs\MyTraffic.cap - using chain captures of size 500.00 MB. ATTENTION: Conversations Disabled: Some filters require conversations and will not work correctly (see Help for details) ATTENTION: Process Tracking Disabled: Use /CaptureProcesses to enable (see Help for details) Note: Process Filtering Disabled. Complete frames are not saved: The first 48 bytes will be stored for each frame. Exit by Ctrl+C Processing | Received: 31 Pending: 0 Saved: 2 Dropped: 0 | Time: 74 seconds. Canceled by user pressing CTRL-C... |
Once you are fed up, just hit [Ctrl] + [C]. This is the actual way to stop the capture, do not worry about the file, it will contain everything and won't get corrupted.
And now what?
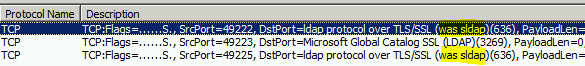
Now we have the list of all IPs which are doing LDAPs with this specific DC during the capture. How can we easily extract them? We have two simple ways:
- Open the capture with Netmon Monitor. You might have a surprise if you do that on the domain controller itself. Remember that we assign a parser with nothing but the Stuff structure. So it will proably look like that:
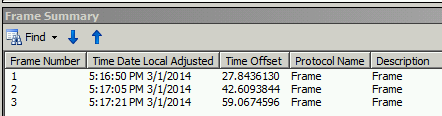
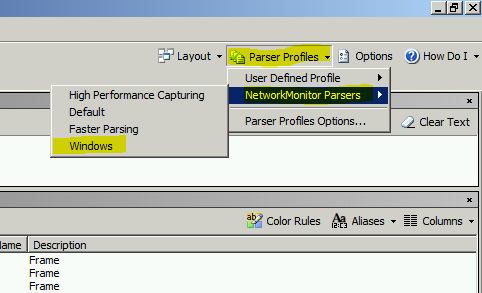
Anyways, we do not open the trace from the domain controller, that kind of defeats the purpose of half of the steps we've done. If you have tested the sparser.npl on your machine and have the same issue, simply reload the Windows parsers.
You will also figure that the frame is truncated. It is not a parsing problem. Well in fact it is, but it's expected. This is the result of our optimization with the /MaxFrameLength parameter.
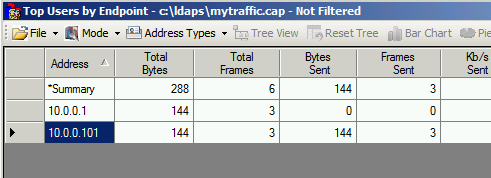
- Use the NMTopUsers expert module. You can download it: https://nmtopusers.codeplex.com/ it has some requirements so make sure you meet them first. For the non initiated, the expert modules are extensions for Netmon and enable developers to integrate their analysis tools directly in Netmon and sometimes also enable you to run those experts in command line.
Another way would be to use LogParser available here: https://www.microsoft.com/en-us/download/confirmation.aspx?id=24659. LogParser has a feature that parses the .cap files and generates other export format such as CSV. Unfortunately, because we truncated the frame LogParser will not do the job.
Now we have a list of IP addresses and we have to contact the owner of the server or check ourselves what is happening on those machines and how they handle the LDAPs.