Techniques for Tuning your Operations Management Suite (OMS) Log Analytics Ingestion
Lately I’ve been working with several customers on onboarding them to utilize the Log Analytics service of OMS. Once the service is up and running and collecting logs based on the Solution Packs enabled, I consistently get two questions/statements. The first is “there’s a lot of data flowing into OMS”, and “how can I tune/filter the data?”.
The first thing I explain is about how the logs are collected, as this seems to be a point of confusion especially in environments that are currently running System Center Operations Manager. When the OMS agent (Microsoft Management Agent (MMA)) is enabled on a Windows and/or Linux system, we pull all of the logging events associated with the OMS Solution Packs. Now depending on some of the Solution Packs there could be certain things that are not logged, but for the majority we are gathering everything. For instance, the Security and Audit Solution Pack, we are pulling all of the Windows security events, Windows application events, and Windows firewall logs.
Unlike System Center Operations Manager, systems enabled for OMS Log Analytics do not participate in any OpsMgr workflows. Meaning you cannot create overrides to turn on or off alerts. The OpsMgr Management group is really just used as a consolidation point proxy for sending data to OMS.
Now let’s talk about some simple techniques you can utilize to discover what the most offending logs and events in your environment could be that is driving up the ingestion rate into OMS. The first thing to do is to navigate to the Log Search and run the following query to discover the top 10 log types in OMS.
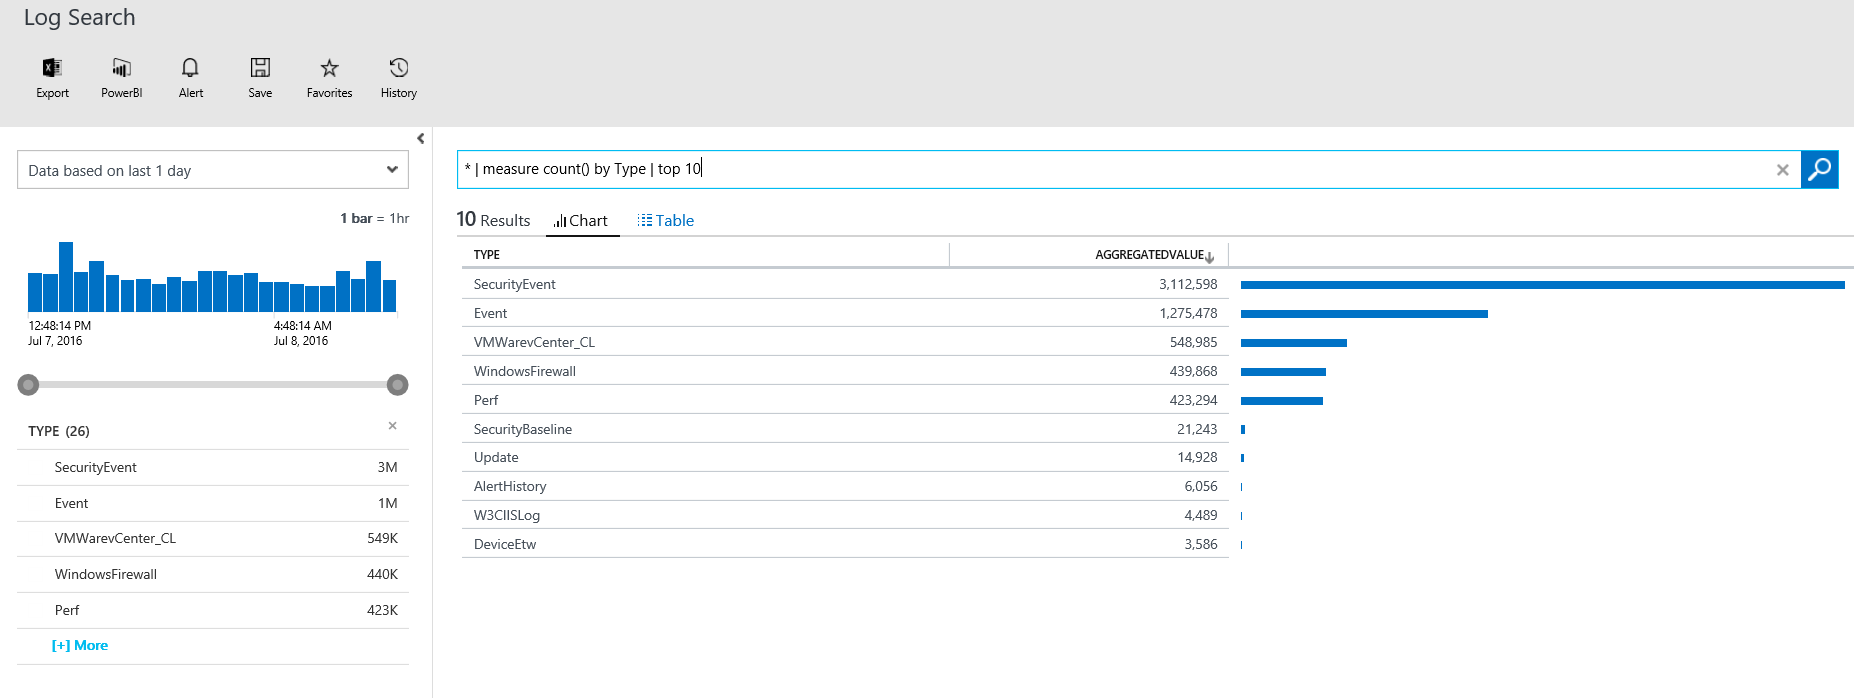
* | measure count() by Type | top 10
Below is the result of the query and I can see that my most offending Type is the SecurityEvent Type.
Now that we know the most offending Type, let’s now see what is the most offending activity in the SecurityEvent Type by running the following query.
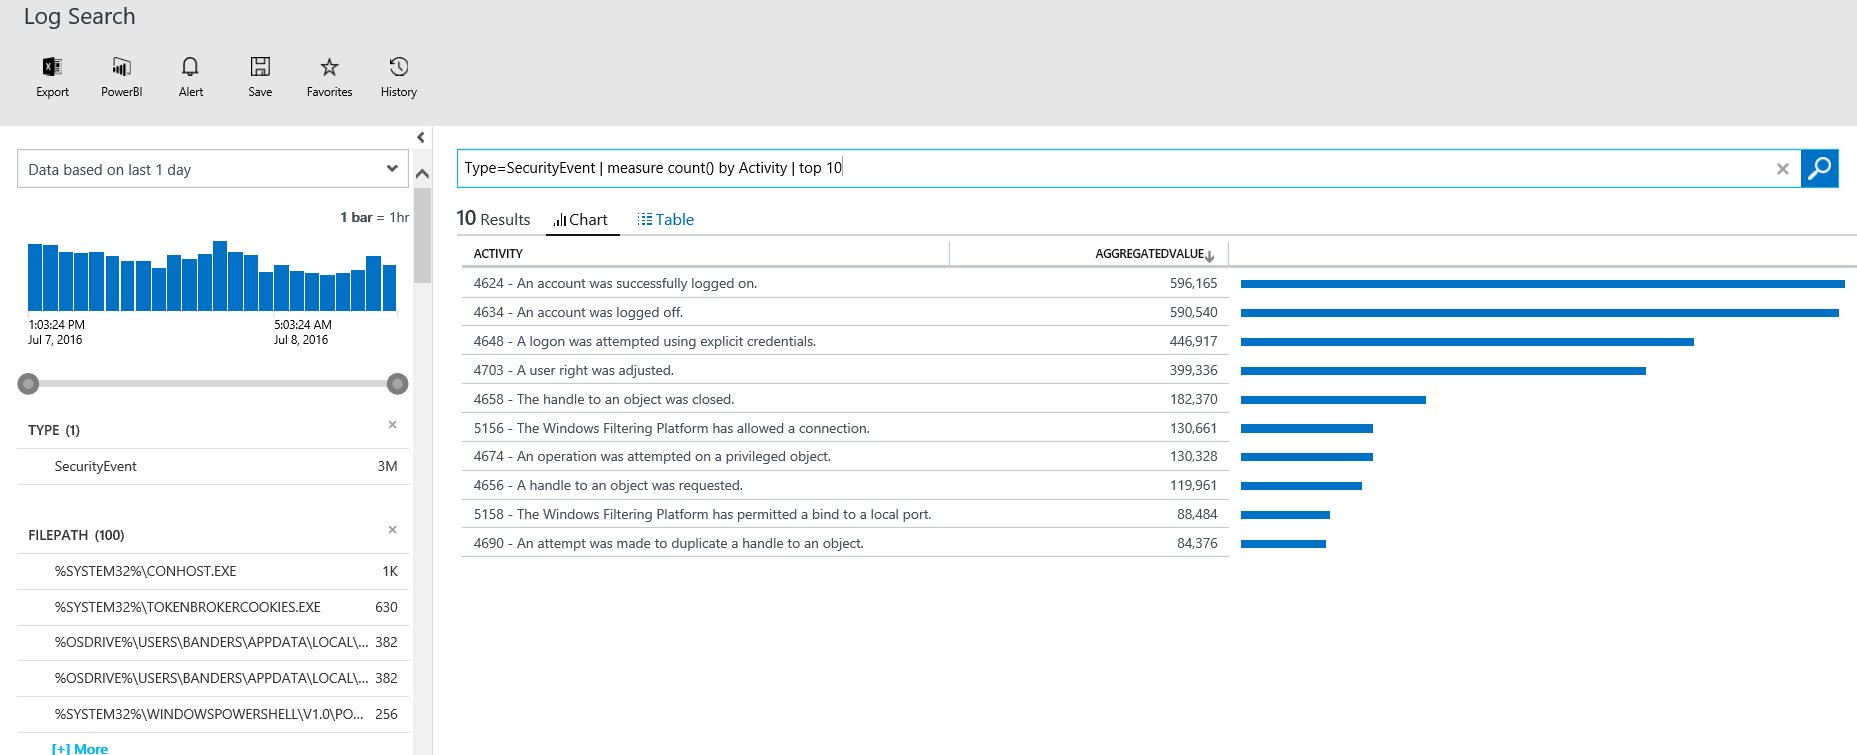
Type=SecurityEvent | measure count() by Activity | top 10
I can now see that I have several event that have collected over one million events each, the top being Event ID 4624 – An account was successfully logged on.
Depending on the specific event data that you are looking to collect for analysis, you will need to go through your policies and processes to figure out what events are of value to your organization. If you are seeing a high level of events that are considered useless to your analysis, then the next steps for you are to edit the audit policies and stop logging those events.
So this was a simple technique to help you identify the events that are the most offending in your OMS workspace. Hopefully this will be of value as you continue to utilize the Log Analytics of OMS.