Application Monitoring – Working with Alerts
Our team has made a few posts around APM with Operations Manager 2012, how to get things running, how it works, and how to simulate errors for testing. Here I’m going to talk about the application centric alerts you will see in OM when you start using APM.
There are two main consoles used for working with APM events, the Operations Console and the Application Diagnostics Console. The Operations Console is where you do your alert triaging and this is the same as working with any other feature of Operations Manager. The Application Diagnostics Console, installed when you install the Web Console, provides deeper diagnostics for the application events that are collected.
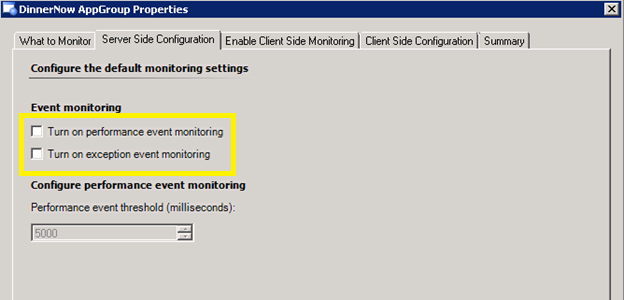
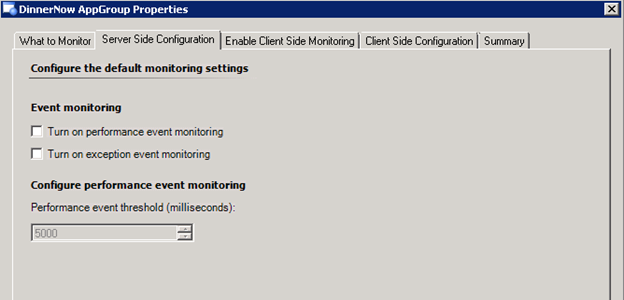
By default performance thresholds are set quite high; this is because you want to make sure you find the major bottlenecks before you start looking deeper. The first time you configure monitoring, use the defaults and then work on tightening the monitoring as you find and resolve the main issues within the application. A good target for the performance threshold is a 5-8 second response time for web applications, this is the threshold at which users typically start to abandon pages due to the perception they are ‘slow’.
Operations Console
With the Operations console there are a couple of ways we raise alerts:
Alerting Rules
There is a rule for each type of event we alert on: Performance, Connectivity, Security and Application Failure. We raise an individual alert when those types of events are detected in the monitored application. These alerts do not affect the health state of the monitored application since a single performance or exception event doesn’t mean your application is unhealthy.
These alerts provide a deep dive into the issues that are happening with the monitored application. Performance alerts provide context around the slow calls and which tier is the root cause of the issue. Exception alerts tell you the type of exception raised, where it came from and the call stack that led up to it. This is the information you need to know so that alerts can be handled correctly: was the root cause a ‘slow query’, ‘connection refused by host’, 'Invalid Logon’, etc.
Monitors
Following the mantra that a single captured event does not make our application unhealthy, we have 3 monitors defined for the applications that monitor performance counters that get registered when the System Center Management APM service is installed:
- Average Response Time: monitors the .NET Apps/Avg. Request Time performance counter
- % Exception Events: monitors the .NET Apps/% Exception Events/sec performance counter
- % Performance Events: monitors the .NET Apps/% Performance Events/sec performance counter
The % Exception Events and % Performance Events monitors are your indicators that the application’s reliability is on the decline. If you are getting a high number of exception or performance events, these monitors will let you know and turn your application unhealthy since it’s time to dig into the individual performance and exception events to find the root cause.
Working with Alerts
Alerts are only raised in the Operations Console, but the underlying events can be accessed through the Operations Console (alerting rules) or Application Diagnostics.
Moving between consoles
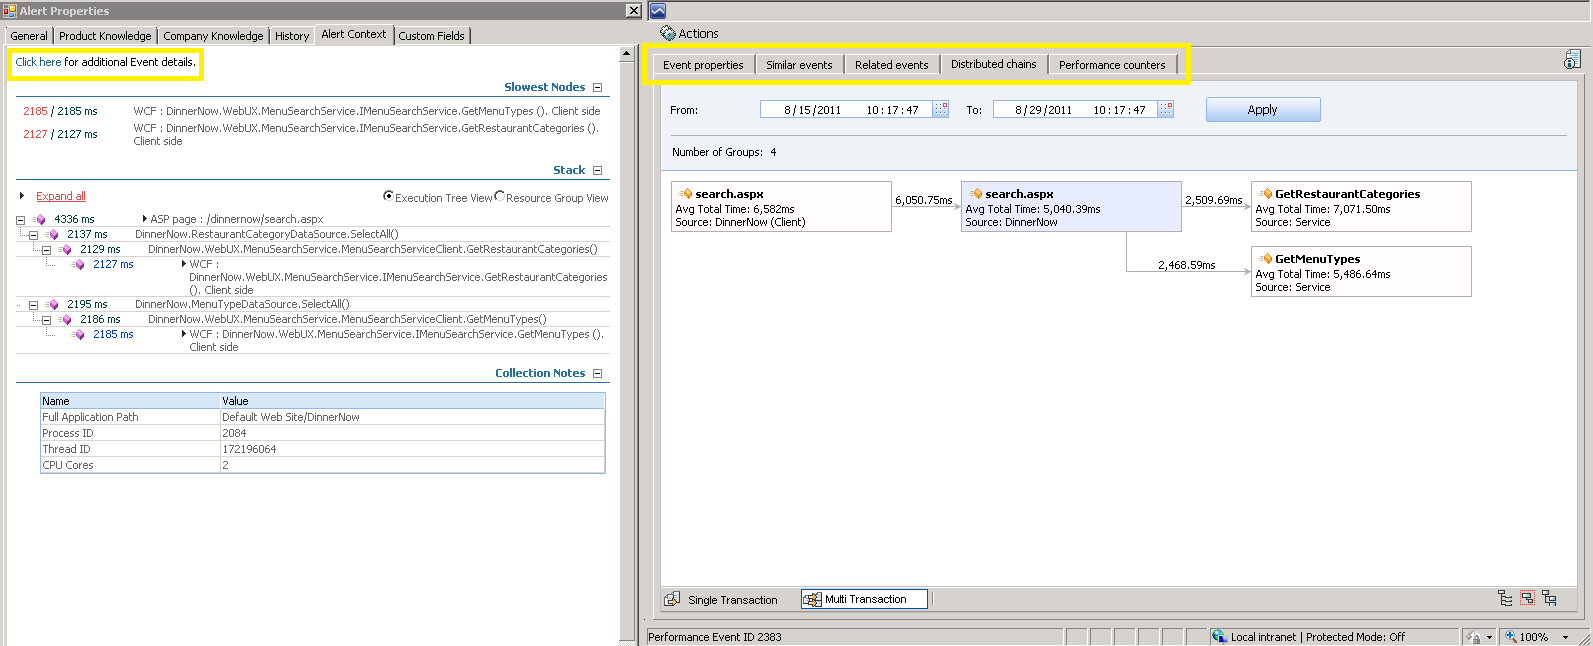
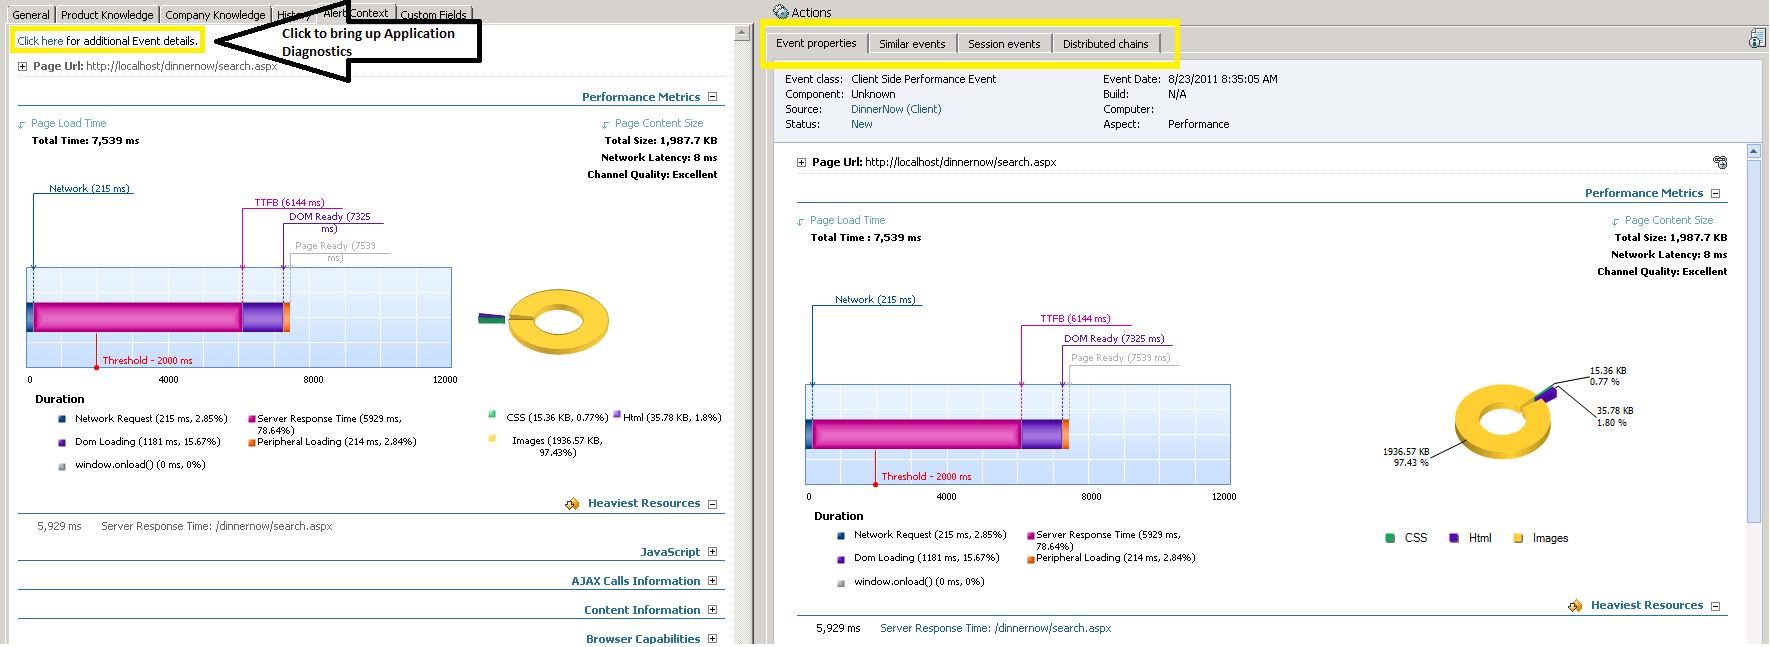
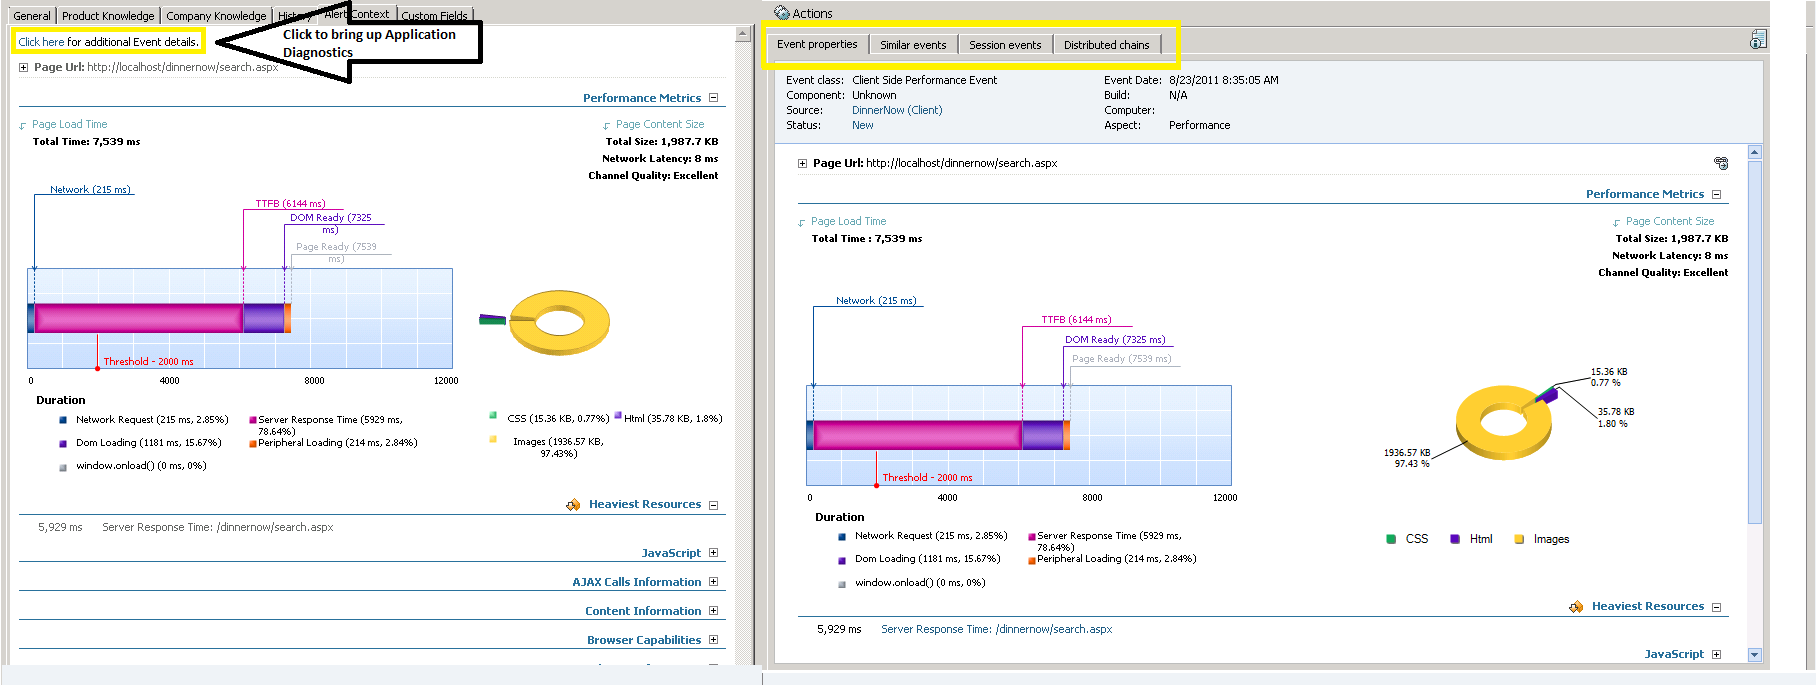
When server or client performance or exception alerts are raised you are given a description of the problem, KB around what the problem signifies and Alert Context that provides a closer look at the cause of the issue.
When working with the Alert Context there is a link in the top left corner that allows you to transition from the Operations Console to Application Diagnostics. With Application Diagnostics you can dig deeper into the alert and look at not only the current event but also related events, similar events, event chains and a snapshot of the server performance at the time of the event. These concepts are outlined in more detail in the Operations Guide.
Controlling Alerts
Finding that you are getting too many alerts in OM? You can disable the alerting rules that I outlined above by un-checking Performance and Exception event monitoring in the template. This will stop the alerts from being raised in OM, but they will continue to be logged to Application Diagnostics.
The flow for working with alerts changes a bit when you do this, now you use the monitors in OM to be notified that there are a large % of performance or exception events occurring and you use Application Diagnostics to drill into the problems. This works well if triaging is done solely by the application team, they can use Application Diagnostics directly and the Operation team can keep the application specific alerts out of the Operations Console. The downside is that you won’t be able to forward the performance and exception alerts through connectors since they don’t get raised in OM.
This posting is provided "AS IS" with no warranties, and confers no rights. Use of included utilities are subject to the terms specified at http://www.microsoft.com/info/copyright.htm.