Application Monitoring Architecture in OpsMgr 2012 Beta
For those who already know me, it has been a couple of weeks since I relocated to the Seattle area and started working as a Program Manager on the Operations Manager Application Monitoring team and this is my first post on this blog. For those who don’t know me, I am a new Program Manager on the OpsMgr team and I come from a previous experience in Microsoft, supporting OpsMgr as a Premier Field Engineer.
The area of OpsMgr I am working on is Application Monitoring (or “Application Performance Monitoring”, or shortly APM) – that is the feature in the product that allows you to achieve monitoring of .NET Applications and obtain rich insights into their health. Michael has already blogged about how we acquired a company called AVIcode, how this technology is being integrated in OM2012 and how the deployment and configuration are greatly simplified in this release.
We now have a single agent, a single set of databases, and the only channel used over the network is OM Channel. While Michael has already shown the user experience for this feature, here I want to go a bit deeper and look at the components and architecture “behind the GUI”.
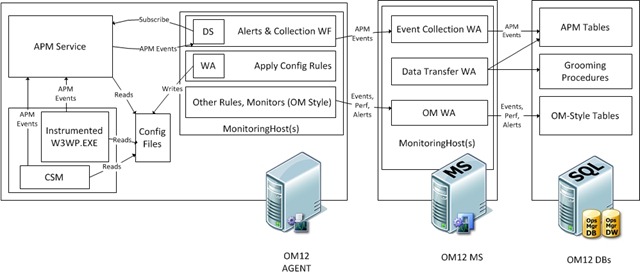
So, first of all, you will have installed OM12 just like Kevin has been teaching you, right? Here’s a diagram which you might find useful to refer to as I go ahead and explain which new pieces you might see as you explore the system and learn the work that those various pieces do.
AGENT Machine
We now have a single agent package/installer. When we push an agent from a Management Server (or install manually), we are really installing two services now: the “usual” OpsMgr Health Service as well as the new "System Center Management APM" service.
Anyhow, this new service is installed but left disabled, therefore it stays “dormant” on most system (similarly to what the “ACS Forwarder” service does) and does nothing until we configure APM. This avoids any un-necessary load on those systems where APM is not going to ever be used.
When you configure APM thru our Template just like Michael has described for you, what happens behind the scenes is that a Management Pack is created, and distributed to the appropriate agents. This MP consists of various things, including configuration for some generic rules and monitors as well as views that are specific to the application being configured. This set of pre-existing, generic rules and monitors will use the configuration to do the following for you (using new write action modules that have been specifically written in order to do this):
- Write (or update) the right configuration files that the “System Center Management APM” service needs
- Set up the service for automatic start up, and enable it
This way, you don’t need to perform any other configuration task, or take care of enabling the service yourself – just running the template wizard takes care of this. Once APM is loaded it uses this configuration to start monitoring.
APM.Agent
So let’s say that you have enabled monitoring for your web application. The application itself (running inside a W3WP.exe, in IIS7) gets instrumented to load our “APM Agent” code.
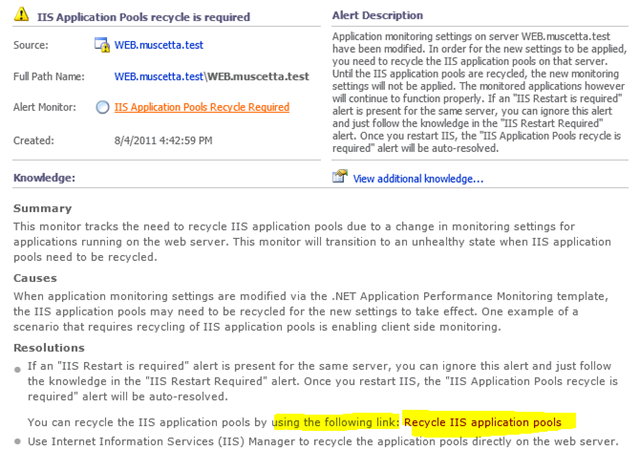
In order for this to happen and depending on the configuration, you might need to restart IIS or recycle a specific application pool. This is of course something that can’t and won’t be done automatically – the Operations Team and the Application Owner should always be planning a maintenance window to do this. Anyway, to simplify the process, we’ll raise an Alert telling you that either of these actions is necessary, and the knowledge base in the Alert will provide a link to a Task to perform the IIS Reset or the App Pool Recycle.

APM Agent produces a couple of things:
- “Events” (“APM Events” in my diagram) that report about:
- Application Exception Events (handled or un-handled by your code) that we are detecting
- Performance Events – method calls in your monitored application that exceed the specified thresholds
- Both the above types of events will also contain a snapshot of how the machine’s performance looked like around the time of the exception, and 15 minutes earlier (we keep watching a few key counters in a sliding window so that when we generate an event, such a snapshot of the performance of the machine around that time is ready and can be quickly attached to the event)
- “.Net Apps” Performance Counters presenting numerical information about exceptions and performance events as they are occurring
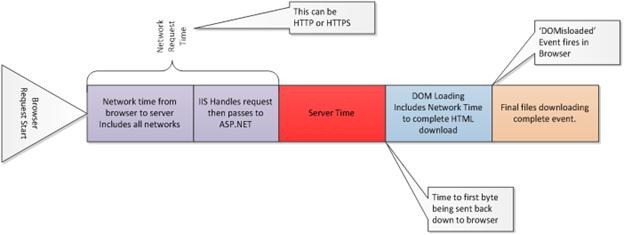
In case we have also enabled the Client Monitoring feature, as a result of the added instrumentation we will also add some JavaScript into the pages returned to our real end users. This is shown in the diagram as “CSM”, and it is what allows returning information around the load times and exceptions being raised in the browser, as opposed to the server side. This is what enables a deep understanding of the end to end user experience, and breaking that down to the client, network and server side, as shown in the chart below:

MANAGEMENT SERVERS
Once the data is received, we use new Write Action Modules that have been written to allow the new data types to be inserted in the database, synchronized across OpsDB and DW, and groomed when necessary. As expected, the user can control data retention, grooming and frequency for these processes.
DATABASES
We only have our “familiar” OpsMgr databases: OpsDB and DW – all of the information previously stored by AVIcode in separate databases are now consolidated within OpsMgr databases. This means we have a bunch of new tables in both OpsDB and DW, as well as some new synchronization and grooming mechanisms. As expected, the user can control data retention, grooming and frequency for these processes.
UI / CONSOLE
“Application Diagnostics” and “Application Advisor” consoles are now installed together with OpsMgr WebConsole. Why would I use Advisor and Diagnostics as opposed to OpsMgr Console, and what is the need for new consoles?
- Application Diagnostics organizes and links events across application components
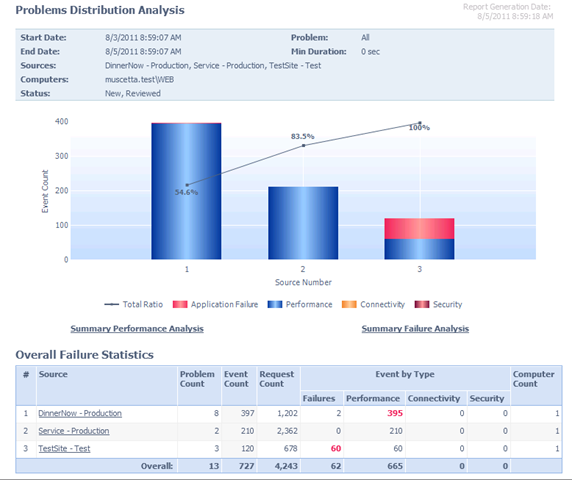
- Application Advisor provides rich, details reports highlighting the top issues within your applications and environment as a whole.
Albeit your mileage may vary, we found that most of the times Developers may not install the Operations Console, and the Operations people might not need to delve into each and every occurrence of an Exception that happened within an application’s code. With Application Diagnostics and Advisor, as they are web interfaces, access can be given to Developers to directly take a look at what they care most about, without completely entering the realm of Operations and without having to install a separate console.

Disclaimer
This posting is provided "AS IS" with no warranties, and confers no rights. Use of included utilities are subject to the terms specified at https://www.microsoft.com/info/copyright.htm.
