Application Monitoring with Operations Manager 2012
Microsoft acquired AVIcode at the end of 2010. Starting the day the deal closed we have been working hard to integrate the AVIcode technologies into Operations Manager 2012 and with the beta release you can start to use the first phase of our new .NET Monitoring features that are focused on IIS 7 hosted web applications and services:
- Monitor without having to write a management pack
- No requirement for the application team to add special instrumentation
- Consistent metrics for all monitored applications
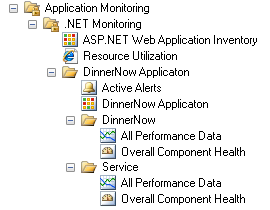
- Application Diagnostics console that organizes and links events across application components
- Application Advisor console that provides rich, details reports highlighting the top issues within your applications and environment as a whole
- Monitoring both the server-side components and the client-side browsers
How do you use it?
.NET Monitoring is a part of OM, there is no additional infrastructure to roll out and maintain, the required service and modules are all installed as part of the OM installation/upgrade. The only additional step you may need to do is importing the Windows Server 2008 Internet Information Services 7 MP. The IIS 7 MP is used to discover the applications we will monitor.
Once you have the application inventory available, you need to know 2 things:
- Which applications do you want to monitor
- What is the SLA you want to apply to the application response time
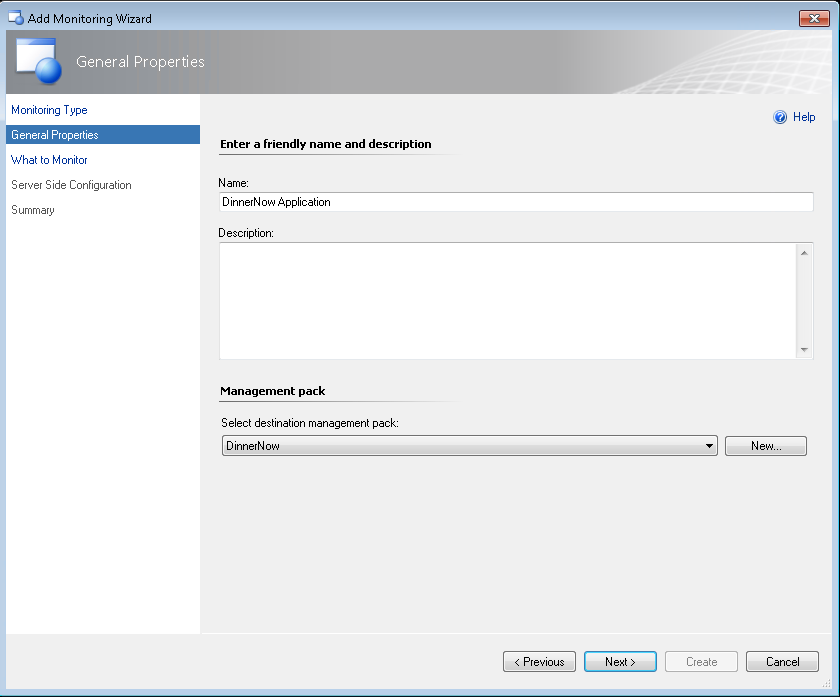
With this information, you use the .NET Application Performance Monitoring template wizard to configure monitoring.
- Launch the wizard and define the application group
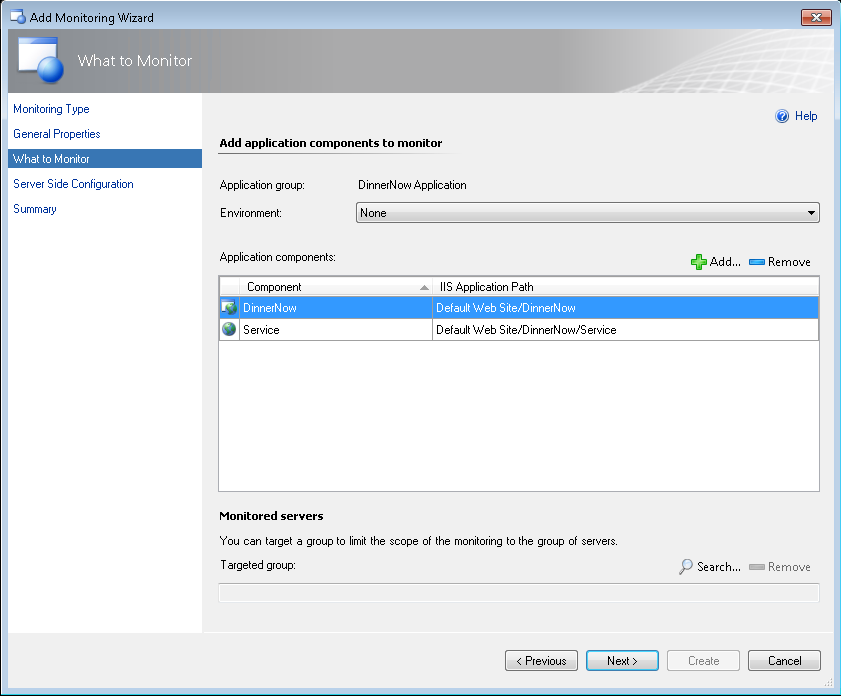
- Select the applications to monitor using the configuration defined for the application group
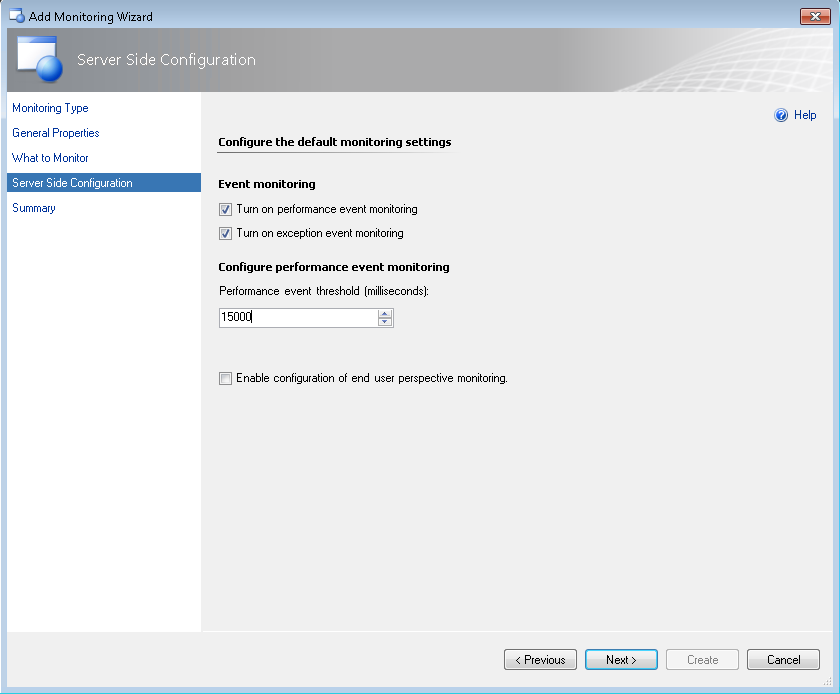
- Define the SLA you want to use for the application group
That’s it; you are now monitoring the appliction group.
What do you get?
- New application specific performance counters registered under .NET Apps for server-side monitoring and .NET CSM Apps for client-side monitoring:
- % Exception Events/sec – the % of monitored requests that result in an exception event being raised
- % Performance Events/sec – the % of monitored requests that result in a performance event being raised
- Avg. Request Time – the average amount of time it is taking for requests to be processed (.NET Apps only)
- Monitored Requests/sec – the number of request hitting the monitoring application (.NET Apps only)
- Average page request execution time - the amount of time it takes for a web page to load (.NET CSM Apps only)
- Requests/sec - the rate of requests made to web pages of the monitored application (.NET CSM Apps only)
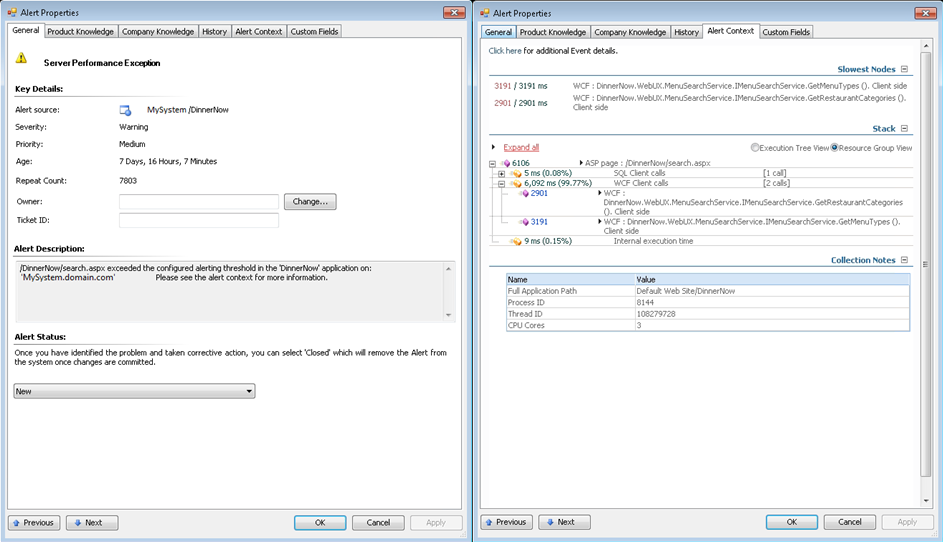
- Performance events that are raised when the applications takes longer than the configured threshold to respond to a request
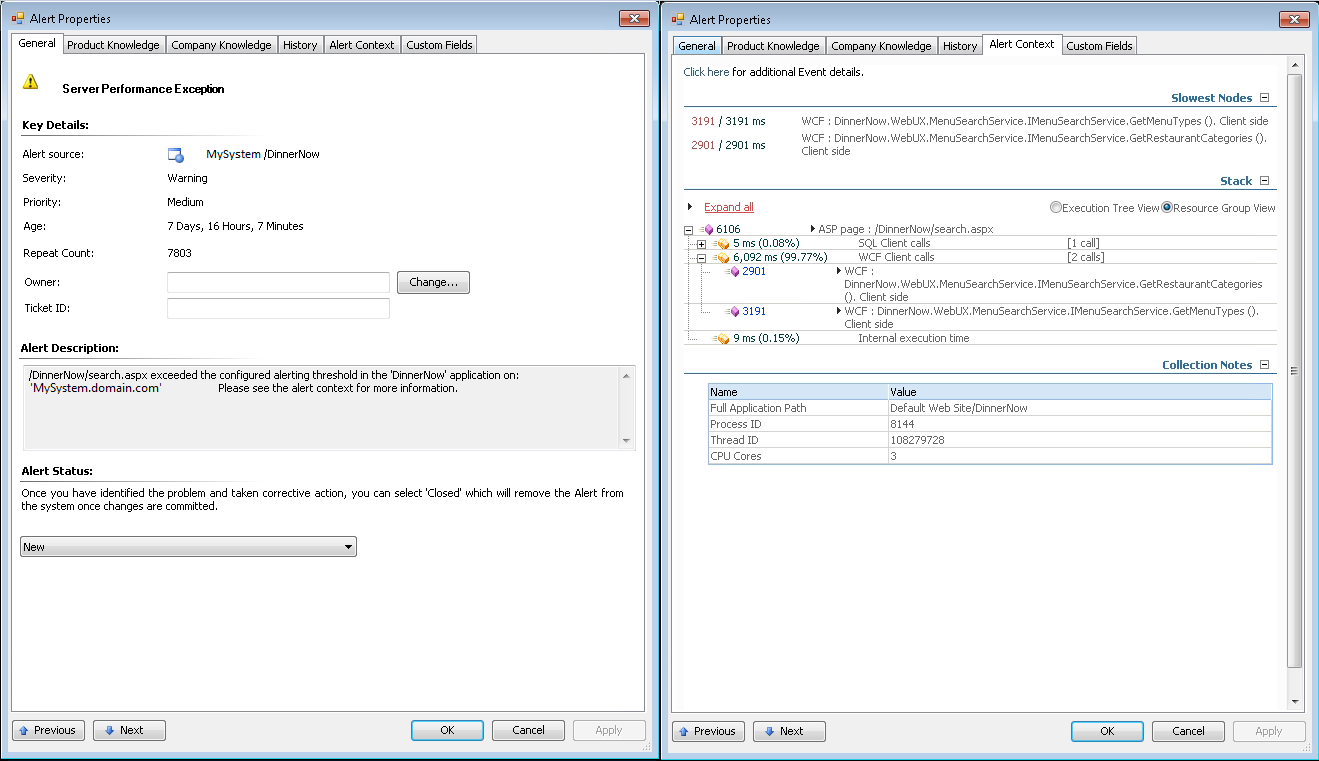
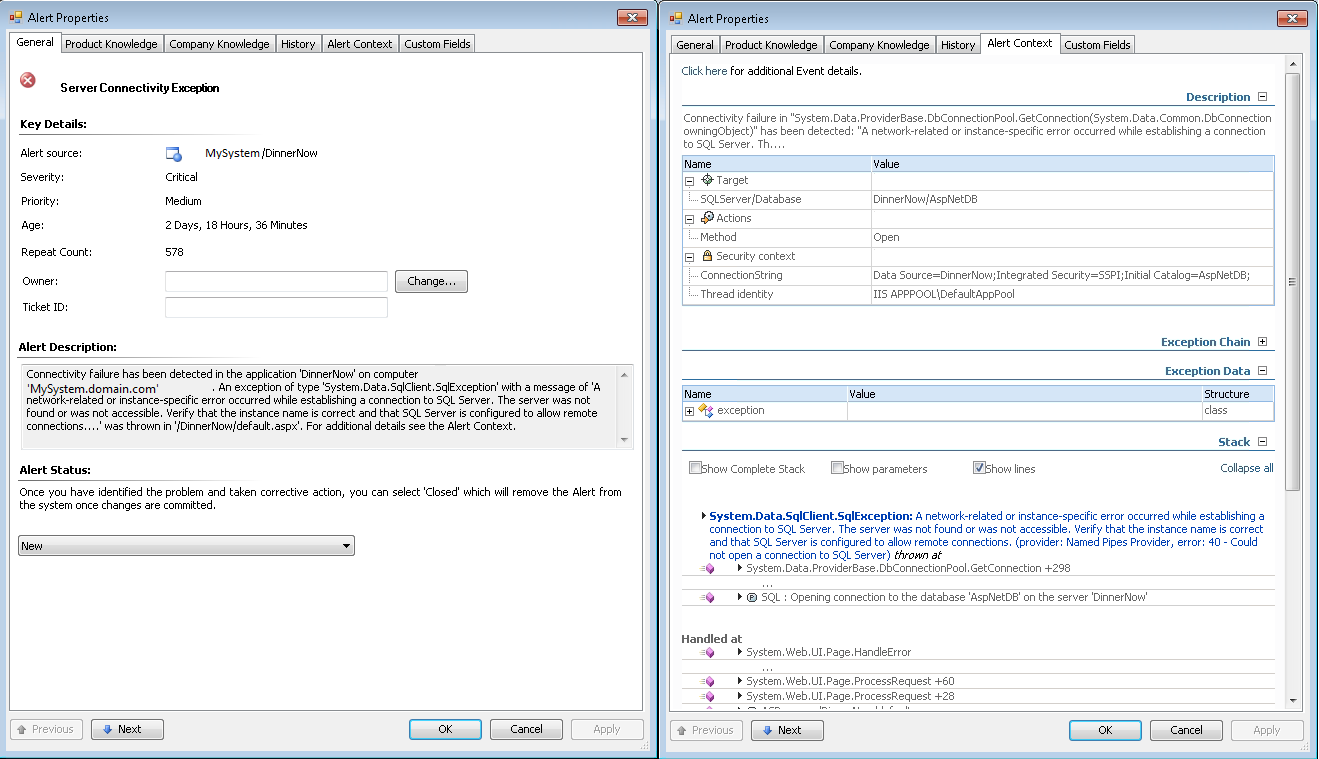
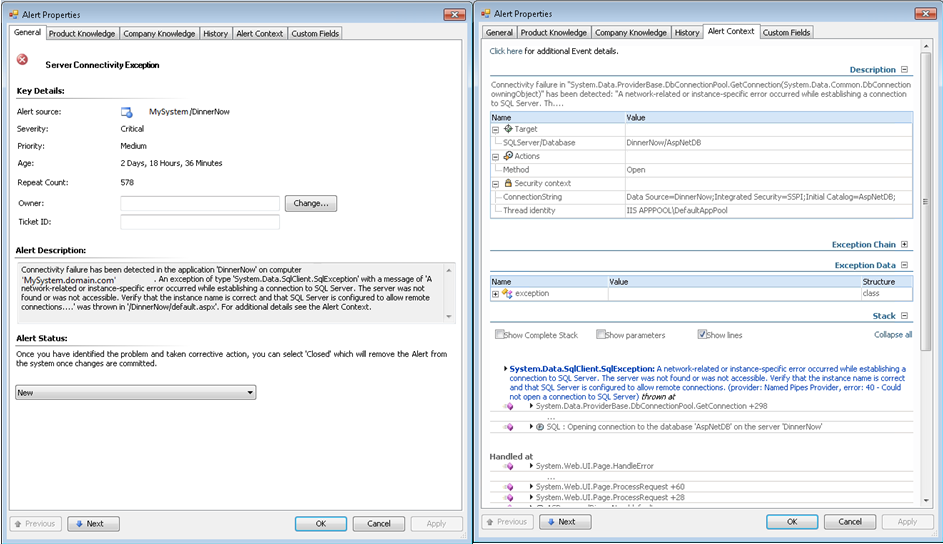
- Exception events that are raised when an application fails to process something correctly
Where to next?
This is just phase 1, we are adding additional configuration options as we move past beta and look to RC. At RC you will have direct control over the monitor configurations, where we collect data, how we collect data and even customizing monitoring for specific web pages and service calls. These are exciting times for anyone who is interested in monitoring both the servers and the applications that rely on them. Operations Manager 2012 provides deep, consistent views into both the infrastructure and the applications; making it much easier to find and resolve issues before they impact your end users.
This posting is provided "AS IS" with no warranties, and confers no rights. Use of included utilities are subject to the terms specified at https://www.microsoft.com/info/copyright.htm.