How to analyse Application level performance for Outlook and SharePoint online
If we've stepped through all the network level checks and all looks good from that perspective, then we need to move up the stack to the application itself and see if something above the network is causing performance issues.
This can prove tricky with Office 365 as the information is almost always encrypted within an SSL session, however there are a number of methods we can use to look at how the application itself is performing and how long the requests we send to the remote server are taking to get a response. From this we can see if we've got a problem with the client or on the Datacenter side.
When we're working on-prem this is a lot easier. We can normally match up a request to a response as long as it's in the clear by using a network packet sniffer such as Netmon or WireShark, so we'll be able to see an RPC call to its response in Outlook and a HTTP GET to its response in SharePoint. When these requests are encrypted then that becomes impossible. So how do we do it? Well the methods vary with each product:
I've tried my best to make the images viewable without clicking out, any smaller ones should have a link to view full page if you need though.
Outlook
Outlook performance can be a tricky one at the best of times, especially so when using HTTPS.
We can however use the inbuilt connection status tool to look at the performance. Ctrl + Right click the Outlook icon in the bottom right of your task bar and click on 'Connection Status'. This will give you a whole heap of information on Outlook's connectivity.
Here you can see the Outlook 2013 output (the format and content varies with versions of Office)
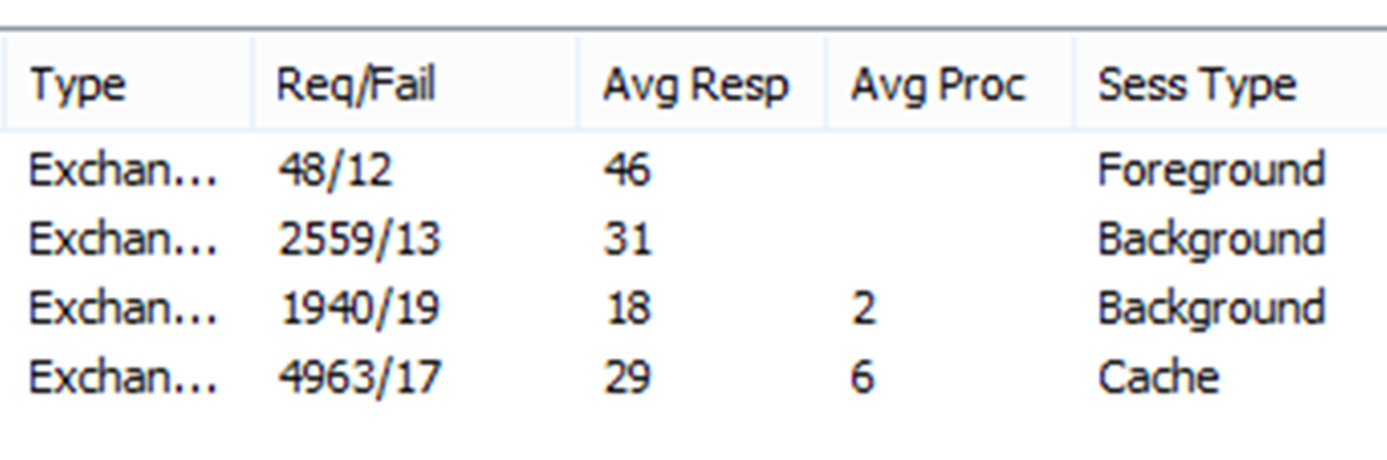
From here I can see how many connection to Exchange I've got, the type, and some information on the RTT and processing time (Avg Resp & Avg Proc respectively). We can use these two values together to see the RTT as measured by Outlook. If we take the cached connection with 4963 requests then we have the following:
- Avg Resp: 29
- Avg Proc: 6
- Avg Resp shows us the RTT measured by Outlook.
- Avg Proc shows us the processing time, how long the RPC processing latency is, how long the server took to construct the response. If this is high it indicates a problem on the server side.
By subtracting 6 from 29 here, we get the latency which is 23ms
To confirm this I can use PSPING to connect to the mailbox and this shows an average of 20ms.

A great blog by a Microsoft colleague here describes these tests in more (and better) detail but this is a good test with inbuilt tools to show if we have latency or a delay on the Exchange side. The blog also outlines some great steps to take to look at other ways at the client and Outlook performance to see if there are any issues there
I normally also take a network trace whilst starting Outlook, then whilst performing actions such as opening a new mailbox, switching calendars, sending a large mail and then analysing the traffic for symptoms described in my blog post.
If you're running a newer version of Windows, you can also use Resource monitor to get a view on your round trip time for Outlook connections.
SharePoint:
There are a number of tools we can use to look at the page load performance within the browser.
If you're using IE then the inbuilt tools are a good starting point, especially with the newer versions of the browser.
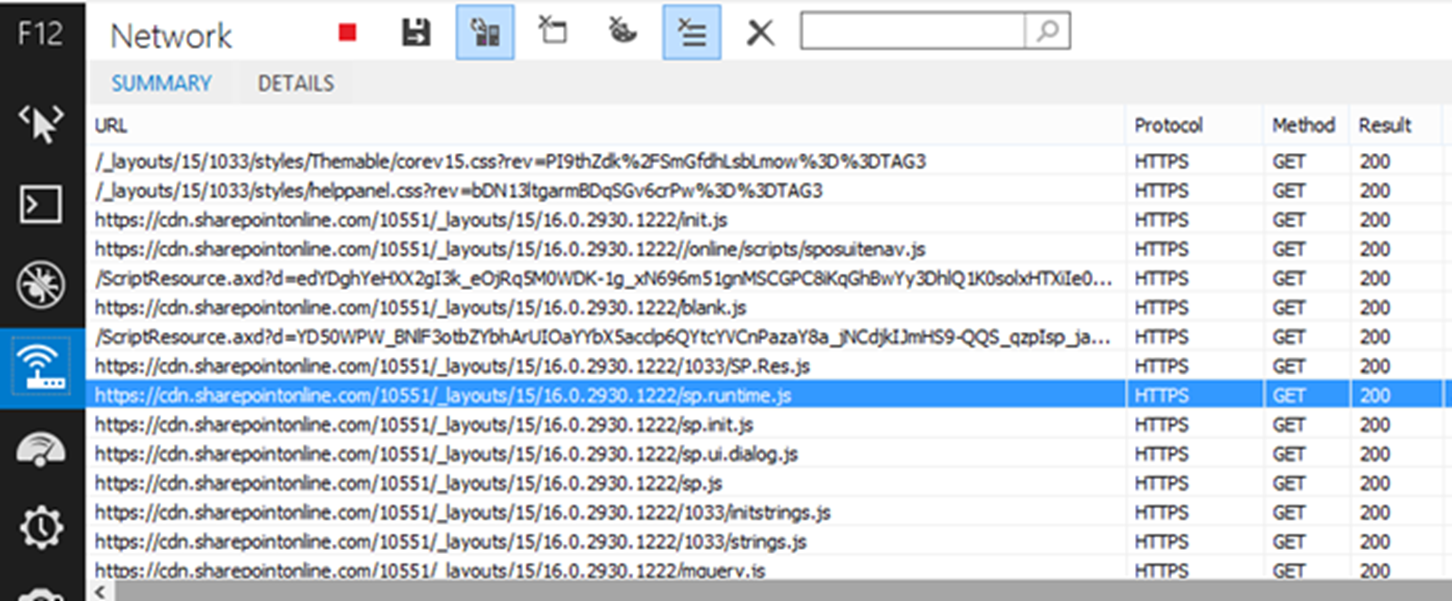
By hitting F12 and using the inbuilt tools to trace the page load, we get information on each element of the page and how long it took to load and how big it is.
Here we see the URLS opened and the HTTP response code.
IE F12 Tools:
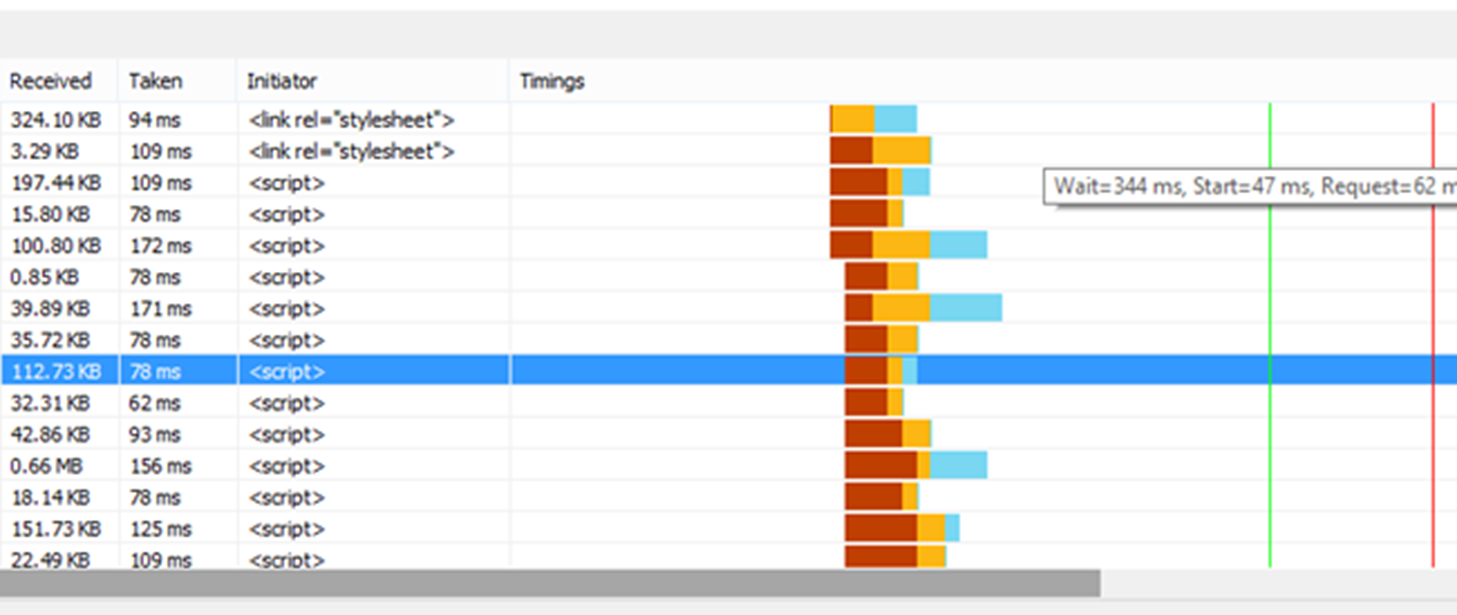
And over to the left of the same screen we get more information on how long it took for this to complete.
Fiddler:
Fiddler is a tool which inserts itself in front of the browser and allows us to capture encrypted requests in the clear and shows us the time it takes for each request to complete and allows us to spot any problem elements of the page which is slowing us up.
Here you can see information similar to that of the F12 tool but with more data.
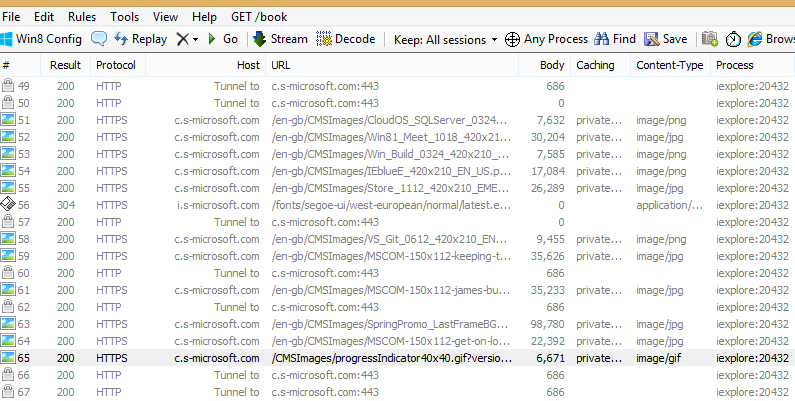
Over to the right when we click on a URL we see detailing information on how long each stage of this connection tool. For example we have information on how long it took to get the server response, and to complete this response. This sort of information is enough to give us an indication on a slow loading SharePoint page how quickly we got the initial response and subsequently all the data.
If we select multiple URLs and click on Timeline we can see a graphical view of how long each stage took.

This is just intended as an introduction to the tool, the help file is pretty good as is the support community on the website, and there is a book if you're keen. As this is a third party tool (i.e. non Microsoft) I can't vouch for it but I know we use elements of the tool in our new Message Analyzer tool.
HTTPWatch
My personal tool of choice however is HTTPWatch. This is a free tool which works with most browsers but you'll have to buy the full version if you want the extended features but is well worth it if you do this on a regular basis and your boss will stump up for it!
This essentially acts as a proxy in front of your browser and allows it to see the elements of the page as they load and for me is the easiest to use and understand whilst giving me some great information on what the performance is like. Again, this is a third party tool and I can't vouch for it but we do use the full version within Microsoft and I personally use it extensively.
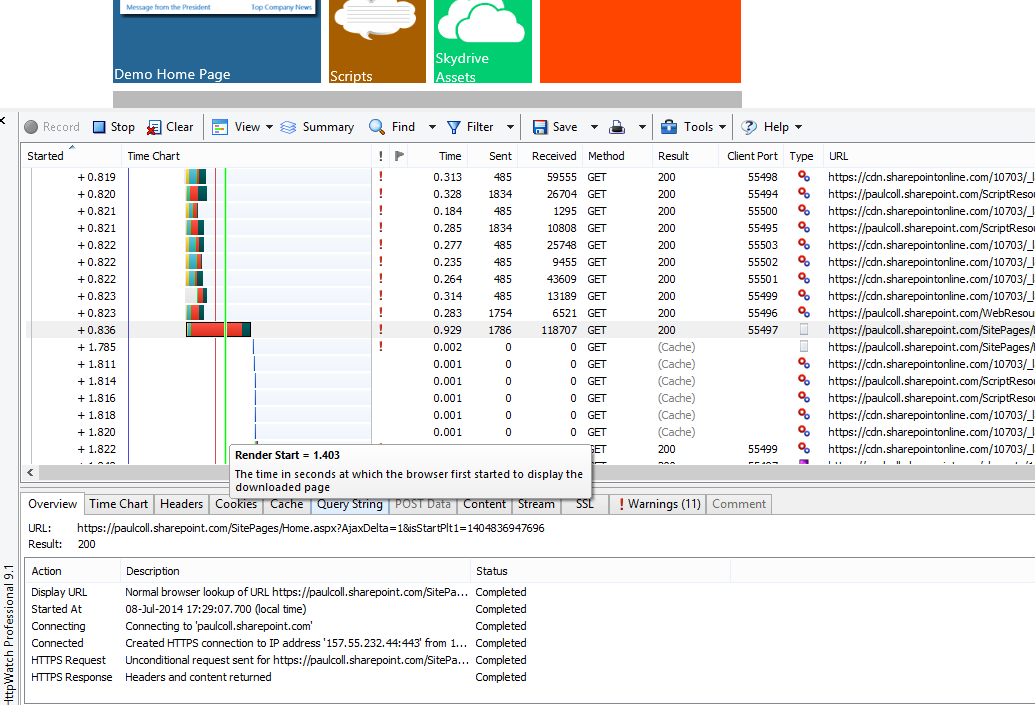
I'll use IE as the example browser here but the tool works with Firefox on Windows. Once installed, if you hit F4 to get the menu up, you should see HTTPwatch as an option, click that and a window should open up at the bottom of the tab.
Hit record then enter your URL. Here I opened my test SharePoint page in Office 365. You can see clearly in the timechart which section took the longest to load (the one highlighted took 0.9 seconds) and if you had a poorly performing section of the page, this would be as clear as day in this timechart. I've also hovered over the green line which indicated when the page's rendering started in IE. So I can clearly see here that at 1.4 seconds after entering the URL the page was visible to the user (although some elements were still coming in, in the background).
In addition to troubleshooting slow elements of a page, you can also can use this green line to measure a baseline of page load times, either for comparative purposes to an on-prem solution or perhaps before and after a network or page structure change. It's also useful to be able to compare page load performance from different sites.
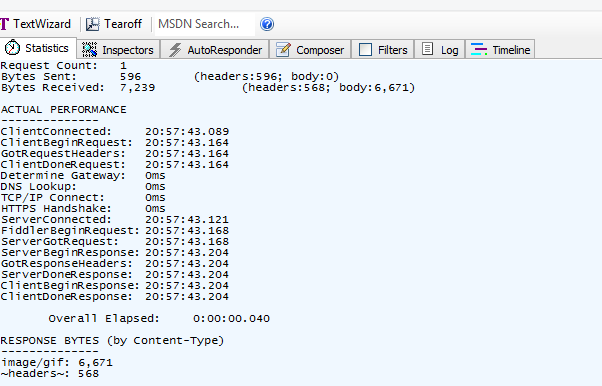
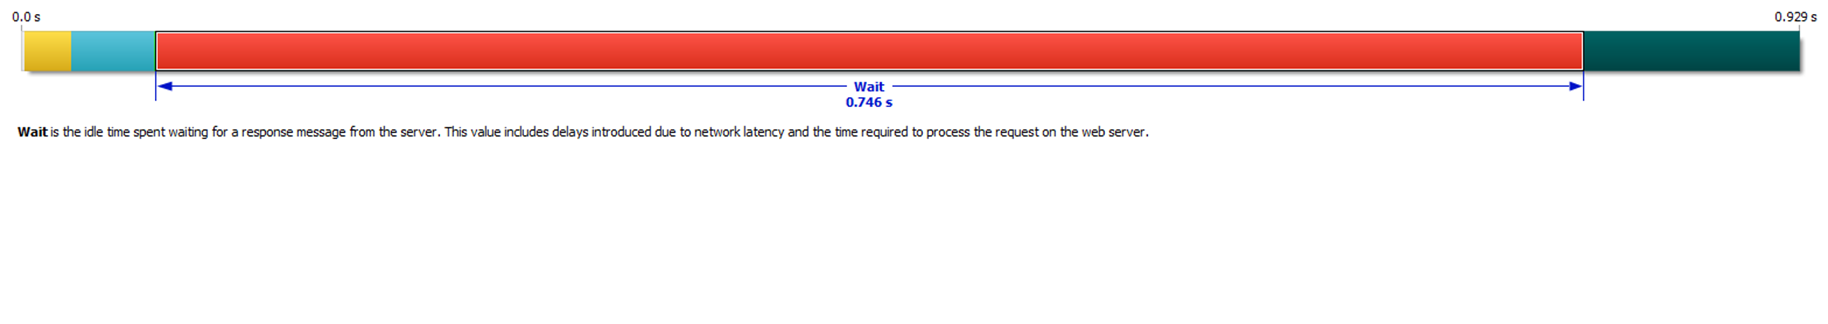
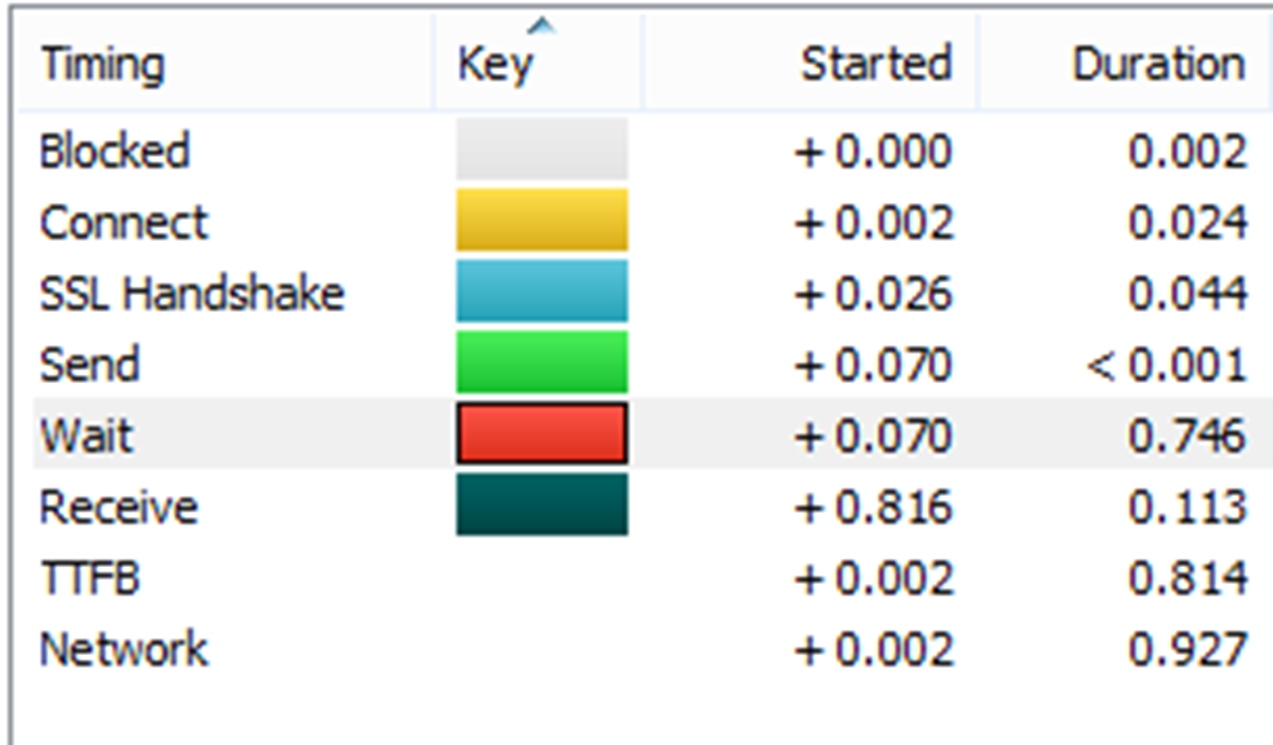
If I then click on the time chart for that URL that took 0.9 seconds I can see where that time was spent in more detail. Here we can see the connection and SSL handshake took no time at all, but we spend most of our time waiting for a response from the server. Once we get the response, we receive the data in 0.1 seconds. In this example, 0.7 seconds waiting isn't too long a time but if this information gives us some great ideas on where the problem is. If receive was longer than expected, then perhaps we've got a slow network, or one of the other network tuning issues in my blogs is causing it to take a long time. Let's imagine Wait is the longest (like below) but taking 10 seconds. This would indicate to me that perhaps the SharePoint server is taking a long time to construct a response, have a look at the URL, what is it doing? Is it a poorly performing script or similar?
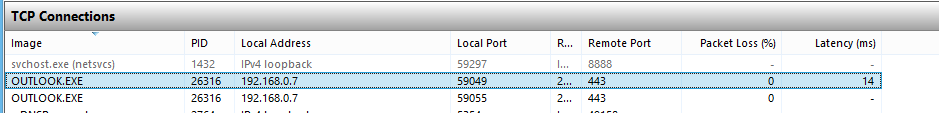
Alternatively this could have been caused by packet loss, perhaps the server didn't get my request for 9 seconds as we had to retransmit it? As we're using the professional edition we can see the local TCP port used for this connection in the columns and thus, we can (and I often do) take a simultaneous network trace and I can use this port information to isolate the TCP session that this GET request correlates to and look at the network performance. If there are retransmits, even with SSL they will be visible in the network trace, you just won't be able to see what call it was which was retransmitted.
So, there are an array of tools which enable us to troubleshoot and baseline the application layer, I've only scratched the surface of what the tools can do but hopefully it gives you at least a starting point to look at application layer performance with O365 (or on prem for that matter).
Paul