Insider's guide to custom reporting in (and out of!) Telemetry Dashboard
Learn how to create custom PivotTable reports using Office Telemetry data in Excel 2013—without using Telemetry Dashboard.
Customers often ask us if it’s possible to set up a separate Excel workbook for creating custom reports of Office Telemetry data. The answer is yes indeed! But it takes some extra steps to get custom reports working just like they do in Telemetry Dashboard. Fortunately, once you save your Excel workbook, you don’t have to repeat these steps again.
To complete these steps, you’ll need:
- A copy of the MyCustomReport workbook that is attached to the bottom of this blog post (download and save it locally)
- The SQL server and database name of your telemetry database
After you have these prerequisites ready, you can start the following steps.
Step 1: Open the MyCustomReport workbook in Excel 2013
- Make sure that the Custom Report worksheet is open. (Yes, the Custom Report worksheet is supposed to be blank.) You might need to enable editing if the file opens in Protected View.
- You can save the workbook using a different name if you want, but don’t make any changes to the workbook contents just yet.
Step 2: Connect the MyCustomReport workbook to the telemetry database and create the PivotTable report
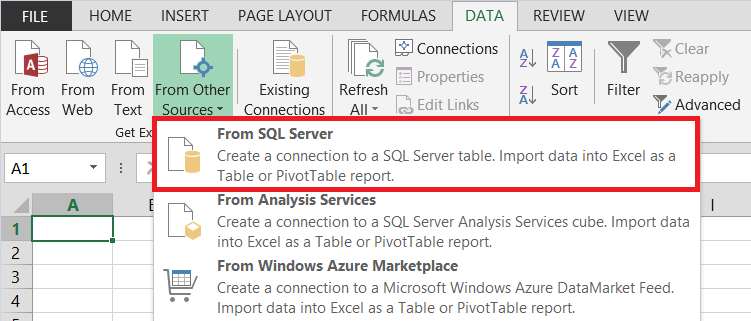
On the DATA tab, select From Other Sources > From SQL Server. (If the command is not available, select an empty cell in the Custom Report worksheet first.)
In Server name, enter the server name and database name, in the form of server\SQLserver. Select Next.
In Select Database and Table, select the database name from the drop-down list, and then select both checkboxes for Connect to a specific table and Enable selection of multiple tables.
In the Name column, select only the following check boxes:
- Events
- Inventory
- Lookup_computers
- Lookup_solutions
- Lookup_users
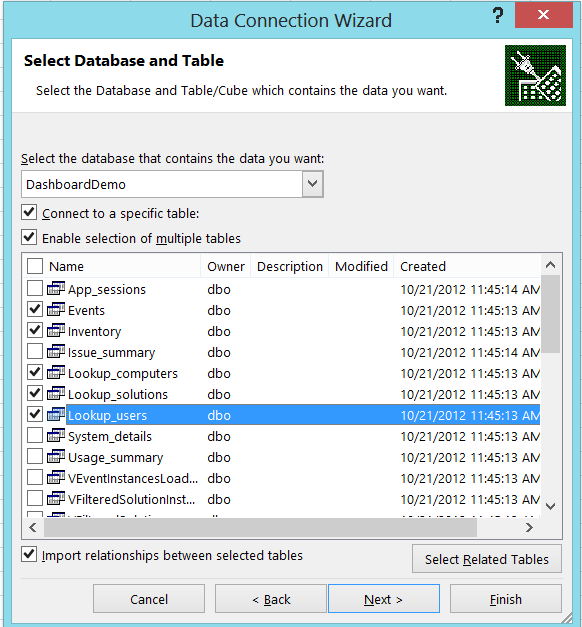
Select Next.
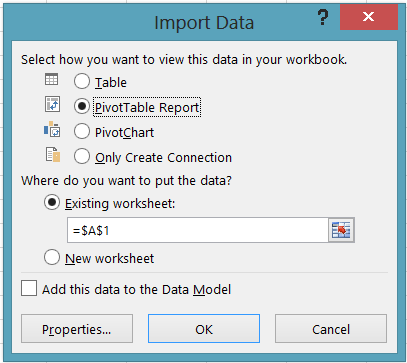
In Save Data Connection File and Finish, select Finish.
In Import Data, select PivotTable Report, and then select OK. It’ll take a few seconds for the connection to be created. The PivotTable Fields pane appears when the connection is established.
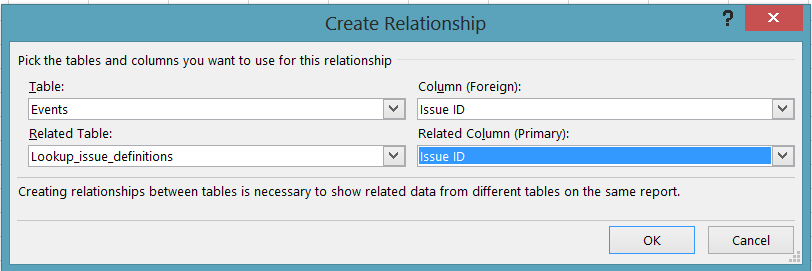
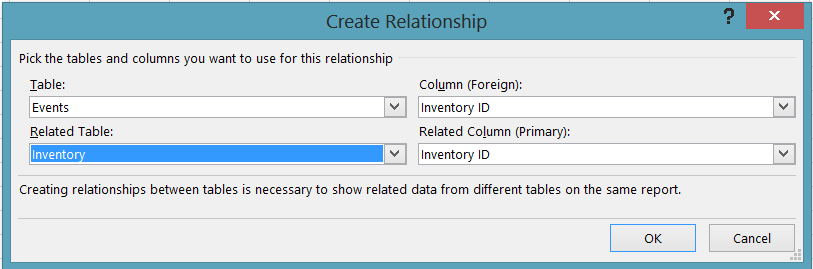
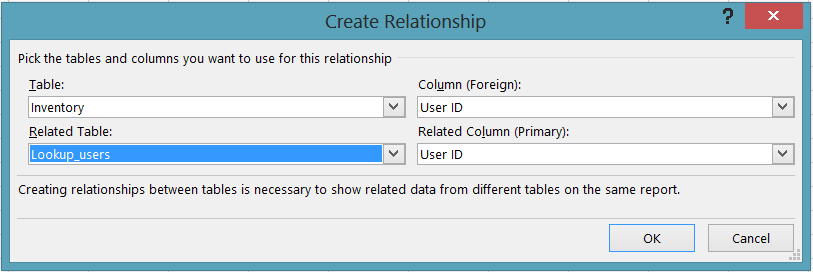
Step 3: Create the data relationships
- In the MyCustomReport workbook, go to: DATA tab > Relationships > New.
- Set up a series of relationships as shown in the following screenshots. These correspond to the custom report table relationships that are illustrated on TechNet.


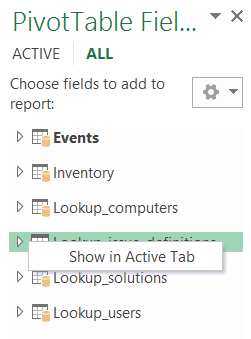
Step 4: Add Lookup_issue_definitions to the Active list in the PivotTable Fields pane
- You’ll see in the PivotTable Fields pane that the Lookup_issue_definitions table isn’t visible in the ACTIVE fields list. To add it, select the ALL tab, right-click the Lookup_issue_definitions table, and then select Show in Active tab.
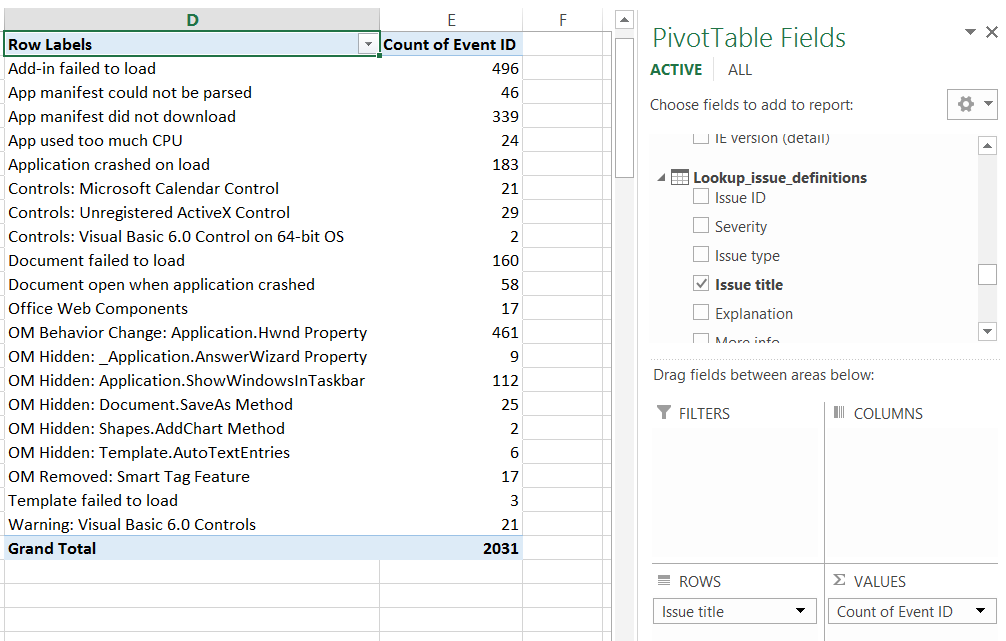
- Now click over to the Active tab, where you can begin to create your custom report. It looks a little different than the default custom report in Telemetry Dashboard, but it’s the same data.
Now you’re ready to create custom reports of telemetry data using Excel 2013. If you’d like to learn more about custom reporting in Telemetry Dashboard, see Custom reporting and database schema reference for Telemetry Dashboard.
Jill