Assess the status of your Office 2013 deployment in 1 minute using Telemetry Dashboard
This post is written by Makoto Yamagishi, a Program Manager with the Office Solutions Management team
In this series of blog posts, we have introduced how you can use Office Telemetry Dashboard to facilitate your Office upgrade by identifying important Office solutions and monitoring how well your solutions perform with Office 2013. In this post, we’ll discuss how to take a big picture view of your deployment and start drilling down to figure out action items.
How many unstable solutions do I have?
Every Monday morning, you open Office Telemetry Dashboard to see if there are blocking issues that require your investigation. For example, with the quarter-end coming up, are the sales reporting solutions running well with the new Office? You want to quickly understand how your critical documents and solutions (add-ins) are behaving on users’ machines. Instead of browsing Documents and Solutions views, which show you item-by-item status, you can open and refresh the Overview page to see a high-level view of document and solution stability. From here you can decide your next steps.
Let's start with looking at a screenshot of the Overview page.
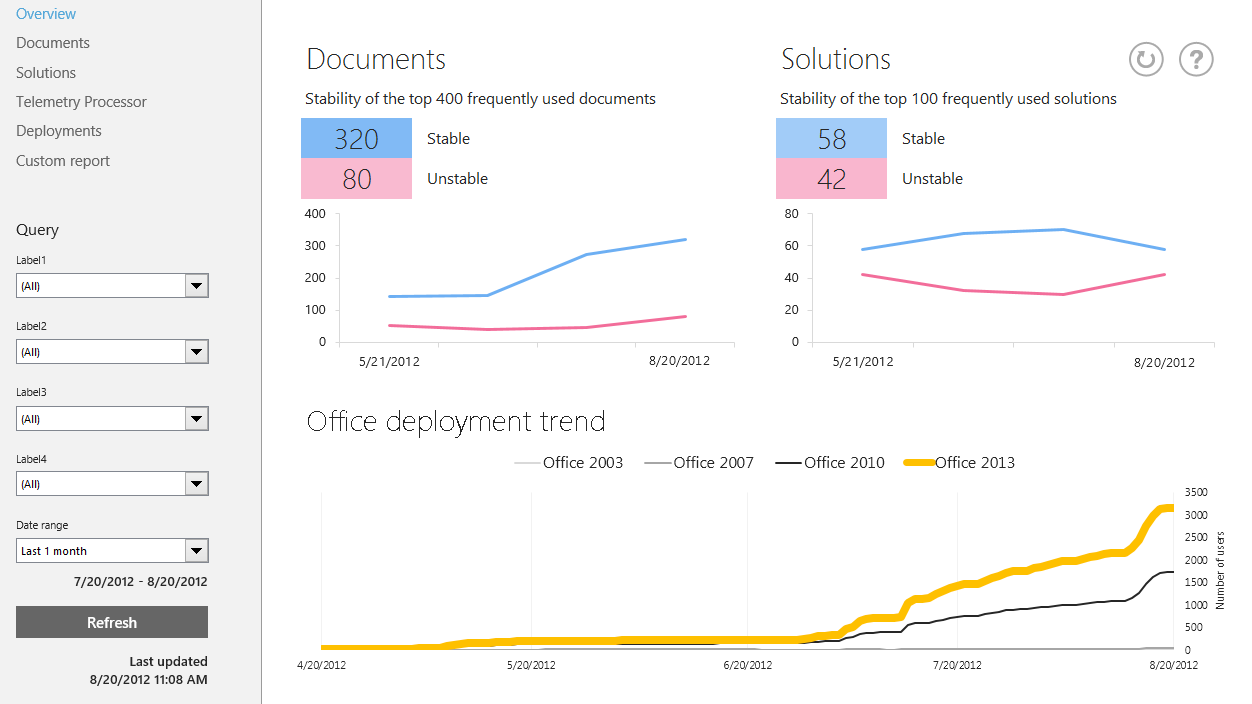
The first thing you may notice is the set of highlighted numbers at the top of the page. These four numbers show the count of stable and unstable documents and solutions. If you see a high unstable count, then that means you need to investigate what is happening.
So how are these metrics for ‘stable’ versus ‘unstable’ calculated? The underlying logic is simple. If the documents or solutions have success rates less than 90%, then we consider them as unstable. The success rate is determined by the percentage of sessions where the document or solution operated without a critical issue. The critical issues tracked by Office Telemetry include application crashes and macro calls that would definitively fail for compatibility reasons, among others. A session is defined by the opening of a document or solution or an elapsed 24-hour period where the document is open. If at least 90% of the sessions are trouble free, they are considered as stable.
Another thing to note is that we are not monitoring all documents and solutions. Rather, we pick up the top 400 frequently used documents and top 100 frequently used solutions by number of users. Why the most popular 400 and 100? Because these are the average number of documents and solutions in any given department that are “frequently used,” so we think these are the right sets of items you want to monitor to get the overview.
Which solutions are unstable?
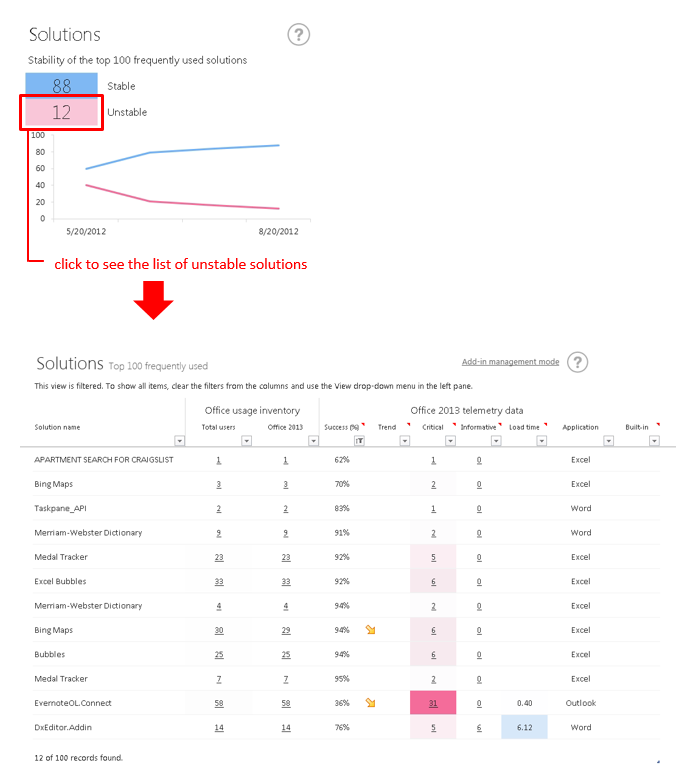
Once you know the number of unstable documents and solutions, you can drill down into the details. On the Overview page, simply click the value to see a detailed list of stable or unstable documents or solutions. Here's an example of what you'll see if you click the link for the 12 unstable solutions shown below.
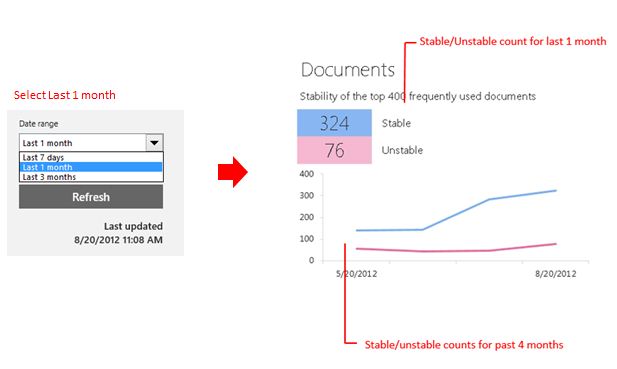
Under the stable/unstable counts, you can see the trend charts that show how stable/unstable counts increased (or decreased) over past periods. If you see an arrow indicating a decline in stability, it is a sign of recent changes triggering issues for your documents and solutions. You can track the stable/unstable counts for an expanded period that is four times longer than the selected date range. As shown in the screenshot below, you can select the date range in the navigation pane, which is located on the left side of the dashboard.
How many users have upgraded to Office 2013?
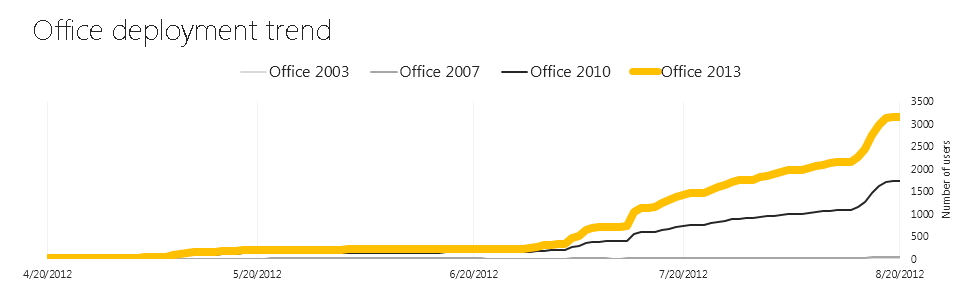
Ultimately, your Office deployment is done when you’ve upgraded all of your users to Office 2013. The chart at the lower part of the Overview page shows the number of users by Office versions and how the Office deployments have changed over time. With this chart, you can quickly check the deployment status and you can also share the progress with colleagues.
Some other notes about the Overview page
- Built-in documents/solutions (the ones that are provided by Microsoft) are not included in the “Top Documents and Solutions” in the Overview page.
- You can change the date range to one of the following: last 7 days, last 1 month, or last 3 months.
Create your own view!
In this post we have introduced the overview page where can quickly see your Office deployment status and jump to the solutions that need attention. As you monitor more documents and solutions, you might want to monitor specific documents and trends, rather than the top 400 pre-defined list. You can do this with a feature called Custom Report. Stay tuned! We will soon blog about this feature.