Top Users Expert for Network Monitor 3.3
One of the major new features in Network Monitor 3.3 is the ability to run experts directly from the UI. And now NMTopUsers is available from our Experts Portal. Plus as it's a CodePlex project, we have opened the source code as well. It's a fairly simple C# project which uses the NMAPI to access data from a trace. You can view and download the source code if you are interested in more details.
What Does NMTopUsers Do?
The problem we are trying to solve is a way to quickly identify the heaviest users of network traffic. For instance you might want to understand if there's a computer on your network that is hogging all the bandwidth. You might also want to identify a chatty machine which could be an indication that it has been infected with a virus or adware.
There are actually two experts in one here. The Endpoint version shows traffic for each machine address, IPv4, or IPv6 address on your network. The Conversation version, on the other hand, shows traffic based on a pair of machines, IPv4, or IPv6 addresses so you can understand the traffic involved between machines.
How Does NMTopUsers Work?
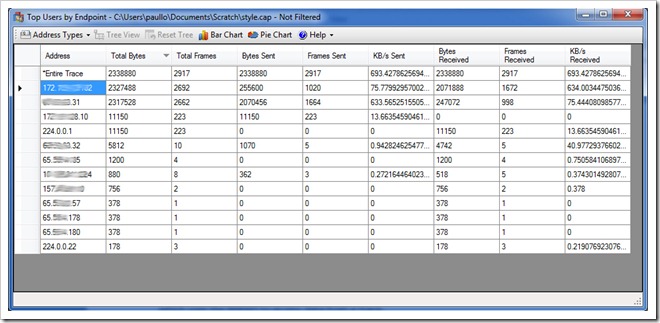
Once you've installed the expert by running the MSI, "Top Users by Endpoint" and/or "Top Users by Conversation" will appear in the experts menu. Once you run the expert a new window will show up and display a data grid. The data will depend on any display filters applied or conversation tree nodes you might have selected. The data grid contains a list of nodes or conversations and then statics on the frames and bytes that have been sent and/or received.
By default the data is sorted by Total Bytes. But you can click on any column header to sort by that column.
The Address Type drop-down lets you select which types of addresses you want to see. By default we only show IPv4 addresses, but you can add Machine addresses and IPv6 addresses as well.
The Tree View allows you to see the IPv4 and IPv6 address as they relate to the Machine addresses that they belong too. But as you can imagine this option is only available if you've enabled the Machine address type. Also if you've re-sorted on a different column in the Tree View, you can reset to the original order by using the Reset Tree button.
Finally you can create a Pie or Bar chart of the information. While sometimes this can be cluttered due to the number of addresses, it can give you a high level overview of the usage. Keep in mind that the Bar chart can't display if you have Machine Addresses selected and multiple IPv4 or IPv6 addresses for a single machine address. This is because the bar chart attempts to line up each IPv4/IPv6 address with its matching Machine address and this doesn't make sense with multiple IP addresses.
Give it a Run
Please go to the Experts Portal and download both Top Users for Conversations and Endpoint. Try it out!
