Part 2: TCP Performance Expert and General Trouble Shooting
Performance issues are one of the more difficult problems to trouble shoot. Without a baseline, it's often hard to determine if something is really slower. But TCP does contain some built-in behavioral patterns that can be used as a signal to tell you something may be wrong with your network.
So the purpose of this article is to provide some indicators in TCP you can look at to investigate and a way to provide a simple graph of TCP traffic that can help you determine if there is a problem and if so what kind.
TCP Clues
TCP is the layer that is in charge of making sure your packet gets delivered. It tags each packet with a sequence number and when something is missing, the client informs the sender. Below I've listed some general things you can filter on in NM3 to give you clues to see if your network is working properly.
TCP Retransmits:
When dissecting a TCP trace, one of the more obvious problems you can spot are TCP retransmits. A retransmit occurs when a client detects a missing packet. From the sender's perspective, he now has sent the packet twice, so the second packet is called a retransmit. While a certain number of retransmits may occur without causing problem, excessive retransmits may be an indication that your network is sick. In NM3, you can search for retransmitted frames by using the following filter.
Property.TCPRetransmit
One you apply the filter, all frames that have been retransmitted will be displayed. Also each displayed frame will tell you the original frame that it is a retransmit of in the TCP Frame Summary. Some level of retransmits may be acceptable, but varies based on your network topology. Here's an example of how it displays in NM3:
Frame |
Time Offs |
Source |
Destination |
Description |
457 |
16.375976 |
Sndr |
Rcvr |
TCP: [Continuation to #402]Flags=....A..., SrcPort=1236, DstPort=Microsoft-DS(445), Len=1460, Seq=658111387 - 658112847, Ack=2995420839, Win=65484 (scale factor 0) = 65484 |
464 |
16.577148 |
Sndr |
Rcvr |
TCP: [ReTransmit #457][Continuation to #402]Flags=....A..., SrcPort=1236, DstPort=Microsoft-DS(445), Len=1460, Seq=658111387 - 658112847, Ack=2995420839, Win=65484 (scale factor 0) = 65484 |
TCP Fast Retransmits
In some cases you may see multiple ACKs one after another in quick succession. The receiver can send these ACKs to the sender to indicate it is missing a TCP sequence range. Normally, a timeout would occur for the acknowledgement of a particular sequence before a retransmit occurs. However, if the TCP sender supports fast retransmit then it will occur after receiving these multiple ACKs. A retransmission generated by fast retransmit also changes the back-off algorithm used. If a retransmit occurs due to a timeout, then the sender reverts back to "slow start." However, if a retransmit occurs because of a fast retransmit then the sender goes into "congestion avoidance." [See RFC 2581 for more information on Congestion Avoidance and Slow Start.]
The response is called a "Fast Retransmit". This can be the behavior you see from one side when packets get lost in another segment of your network. In NM3 you can search for Fast Retransmits with this filter.
Property.TCPFastRetransmits
An example of a Fast retransmit looks like this:
TCP: [Request Fast-Retransmits #370]Flags=....A..., SrcPort=1268, DstPort=LDAP(389), Len=0, Seq=2021124596, Ack=1458852541, Win=64240 (scale factor 0) = 0
TCP SACK option
The SACK option (selective acknowledgments) is like an ACK, but the difference is that it can keep track of multiple sections of missing data. A normal ACK acknowledges the last consecutive sequence number that it received. In contrast a SACK can keep track of multiple missing segments. The SACK option contains multiple segments relating which pieces it has acknowledged and which are now lost. The number of segments is constrained to the amount of space available for TCP options. You can filter on these as well to see if your network is losing packets.
tcp.TCPOptions.Option.SACK
TCP Resets
Resets aren't always a sign that something is wrong. You should try to look at the traffic around a reset to determine if it looks normal or not. Resets can occur when an application shuts down, or if a router is configure to block a port. But they also occur when a problem occurs in a TCP session. So these can sometimes be an indication that something is wrong. The filter to find resets is:
tcp.Flags.Reset
Where's Waldo – Spotting a bad TCP Connection
Being able to take a trace and visualize it can be a useful way to look for performance issues. Most humans are better at looking at a picture and finding differences than analyzing data. Especially the large sequence numbers involved with TCP traffic.
Limitations with this Expert
Unfortunately, there are limitations to that amount of data this expert can deal with. The specific limitations will be due to the memory/CPU power of the machine you are work on. Excel, which this expert relies on, isn't build to plot 1000's of points. So you may want to limit that amount of data you try to analyze. For the following examples, a 500 MB file was transferred from the client to the server.
Using the TCP Expert
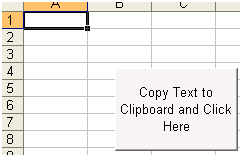
If you are familiar with the Part 1, (https://blogs.technet.com/netmon/archive/2006/11/30/part-1-poor-man-s-expert-using-excel-top-users.aspx), expert that locates the Top Users, then the procedure is much the same. Once you have the Excel Sheet Ready and the NM3 columns aligned, it's just a matter of copying the data in to the clipboard and hitting a button which launches a macro in Excel and creates the graphs we will examine later on.
Setting Up Your Excel Spreadsheet
Basically you just create a new spreadsheet, create a new macro (TCPPerf) and edit it, then paste the code at the bottom of this article. Once you complete this step, you can then take one of the sheets, (I delete all but one of them), and give it a default name like TCPPerf. And finally, create a button on this sheet and attach the TCPPerf macro to it.
Grabbing the data to Analyze from Network Monitor
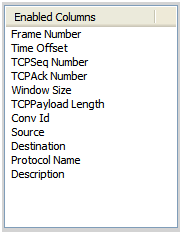
This section describes how to prepare NM3 so we get the necessary columns for our calculations to appear. In NM3 we can add columns for any property that is exposed by the parsers. Actually you can also add any properties you want as well, so basically any piece of data is fair game. In the case of TCP, we want to add in the Seq/Ack Numbers as well as the Window Size and Payload length. So specifically add in columns for TCP Seq Number, TCP Ack Number, Windows Size, and TCPPayload Length in that order. Place them right after Time Offset. The resulting layout should look as follows.
After opening an existing trace or taking a new one, the next step is to filter down the specific data you want to analyze. In my case, I copied a file from my machine to a server. Since Window Size is negotiated in the TCP 3-way handshake, I made sure to disconnect to my client from the server so that may trace contains the entire conversation. I did this from the server in Computer Management under Shared Folders, Sessions. You can simply right click the session in question and select Close Session. Obviously you don't want to do this if you have something important occurring between this session and the server.
In NM3 it's easy to filter the conversations down, by using the Conversation Tree on the left. [Note: This requires that conversations are enabled when the trace is opened or a capture is started. You can set this option from the Start Page.]
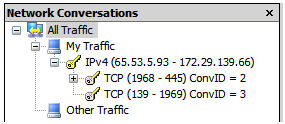
Once you find the IP address pair, you can select each TCP conversation below, and look for the traffic relating to your copy. This traffic will appear as a bunch of SMB Reads (or SMB Writes if you copy to the server), intermixed with a bunch of TCP Continuation traffic.
SMB: R; Write Andx, FID = 0x4004 (\t1_up.tst@#24), 61440 bytes
SMB: C; Write Andx, FID = 0x4004 (\t1_up.tst@#24), 61440 bytes at Offset 184320
TCP: [Continuation to #256]Flags=....A..., SrcPort=1236, DstPort=Microsoft-DS(445), Len=1460, Seq=657940191 - 657941651, Ack=2995420737, Win=64118 (scale factor 0) = 64118
TCP: [Continuation to #256]Flags=....A..., SrcPort=1236, DstPort=Microsoft-DS(445), Len=1460, Seq=657941651 - 657943111, Ack=2995420737, Win=64118 (scale factor 0) = 64118
Once you have located and selected the appropriate TCP Conversation, highlight all the frames involved and copy them to the clipboard. I often use keystrokes, so I did this by selecting the first frame, hit Shift+Ctrl+End, and then right mouse click and copied them to the clipboard.
Now you simply open the Excel Spread sheet you created earlier and click the button. This will results in 4 sheets. The first sheet, PerfData, is just a copy of the data from NM3, plus some new columns that are based off this data. The second sheet, TCPPerf_PerfData, is data copied from the first sheet so that we can sort based off the data we calculated. The final two sheets contain the charts for each side of the transfer. The chart is named based on the machine adress that is sending the data.
Interpreting the Data
Since the resulting data we'll examine is a graph, it's useful to examine different graphs that are a result of different issues so we can refer to these examples as an indicator to the type of problem we may have. In my tests, I have duplicated the following situations: Increased Round Trip Time, Packet Loss, Small Window Size, and Bandwidth Reduction. All traces are taken from the sender (client) which is sending data to the server.
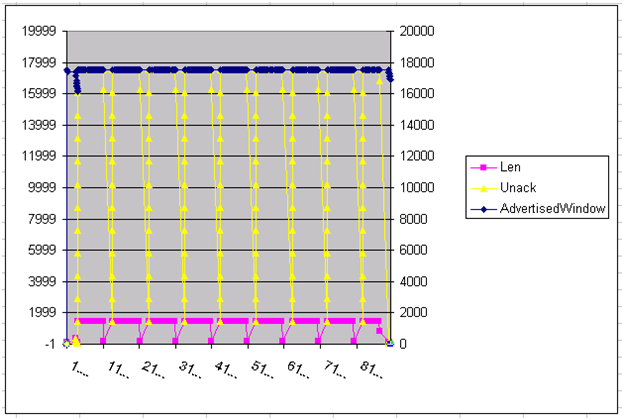
The data is graphed so that the left side axis contains the sequence numbers scaled for Length and UnACKed data. The right side axis is the scaled for the Window Size. Two different scales are used because often the Window size is much larger than the data being sent. UnACKed data is data which have been sent by the sender but has not been acknowledged by the receiver after the TCP timeout expires.
The Graphs
Each test was a copy of around a 500 Meg file from my machine to a server. I used the CMD prompt to do the copy to avoid unwanted Explorer traffic. So we'll start by looking at a base line capture. In this case the Round-Trip-Delay is less than a millisecond, and there are no packets lost. The bandwidth is around 100 MB.
Baseline - < 1 Millisecond RTT, 100 MB, No Packet Loss
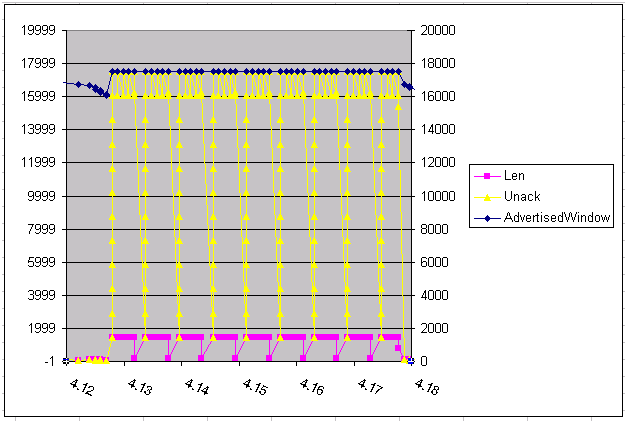
In many of the examples I change the horizontal axis min/max so that the data isn't so compressed. You may find it useful to adjust both the max/min scales on the X-axis depending on how much extra trace traffic you took in your original trace.
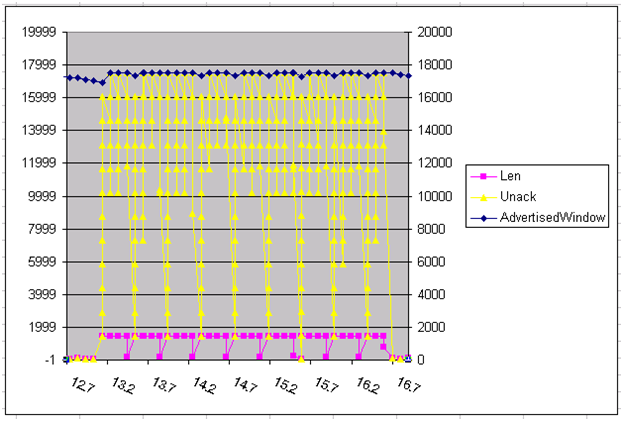
The pink line represents the length of the data we are sending. For the most part it's a full packet size of 1480. The only reason it dips any lower than that is because SMB sends 61440 bytes of info (0xF000), so the dip at the end is the remainder.
Let's look at the UnACKed data (yellow line). The client continues to send data as fast as it can until it reaches the advertised window size (blue line). Note that since the scales for Window Size and Packet size can be vastly different, window size is put on the right vertical Axis. In this case, however, they happen to line up. This is helpful, because it shows that we keep sending data until the UnACKed data reaches the max advertised window size. Once we get to this point, we have to wait for an ACK from the server before we send more data. So we get in a state where we have to wait for an ACK before sending more data. Then once this particular SMB command completes, another delay occurs while waiting for the SMB response which for the next WRITE command.
Since our RTT is very low, we tend to see little effect of this delay. But note that if we had a larger window size we would have been able to even send more data before waiting for an ACK and thus improve the transfer time.
100 Millisecond RTT, 100 MB
In this sample, I purposely set the Round Trip Time to 100 Milliseconds. The basic effect is that anything that requires a response before it can continue, will incur a 100 millisecond delay. So this will certainly affect the time required to transfer the 500 MB file. As you can see here, a total of about 4 seconds is needed now. Another side affect is that since it's slower, the server is able to keep up with the request so the amount of UnACKed data is generally lower.
100 Millisecond RTT DownStream, 100 MB, 5376 Window Size
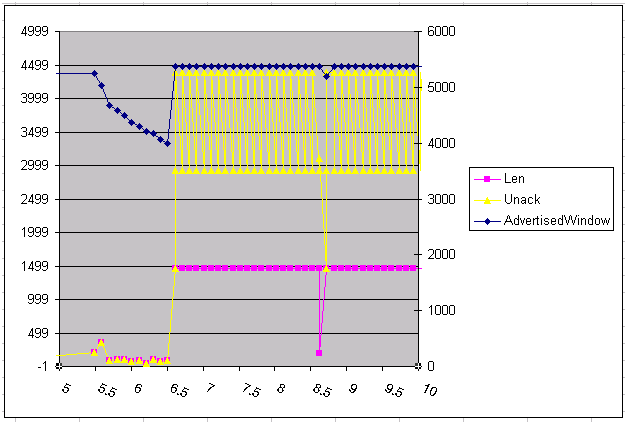
In this example we've cut the Windows size down to 5376 bytes. I've zoomed into a small segment of the entire transfer to show the details. The main thing to note is that we cannot fill the pipe up more than two segments. This means the number of segments we have to wait for an ACK for goes up, thus the total time to transfer also goes up. You can see here, for instance that there are many times we have to wait the return ACK before we can send a new packet (about 20 as compared to 5 in the baseline capture).
Down Stream 100 Millisecond RTT, %5 Packet Loss
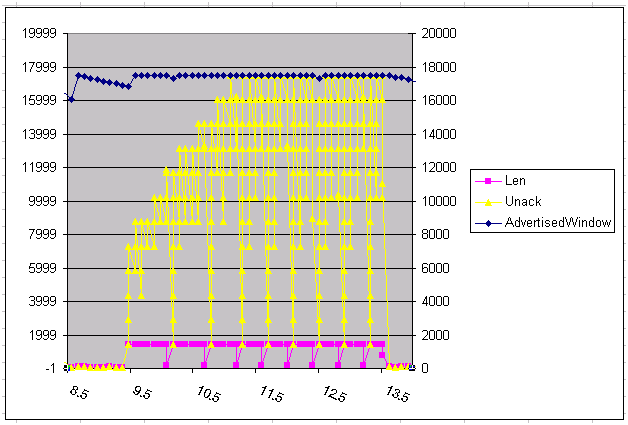
Now we'll add in some packet loss. In this case the loss is on the Down Stream side, which means that responses from the server never make it to the client. Remember that the client is where the capture is being taken, so the resulting trace won't show any retransmits. Since the server's ACKs are being dropped, the client is affected because he cannot move his sliding window due to the fact that he thinks there is more unACKed data than there truly is. Thus the client has a difficult time sending data at a rate that fills the server's receive window. This is shown in the graph by the slow approach of the UnACKed data to the servers advertised window size.
Down Stream 100 Millisecond RTT, Up Stream %5 Packet Loss
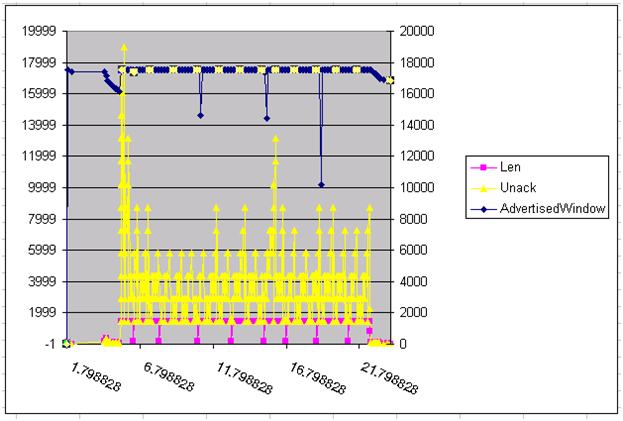
The difference between this graph and the one above it is that in this case the packet loss is on the Up Stream side. So now the client does have to send retransmits, because now the server is complaining that data is missing to the client, instead of the other way around. So now the graph shows up inverted because data to the client can never fill up the window. Instead the client has to resend old data that has been lost. So this resets the UnACKed data to something lower than it was before.
56K Bandwidth Up and Down Stream
The final example is to show the difference when bandwidth is reduced. This is similar to the baseline test, but the main difference is the time line below is much longer. For each SMB Write it takes around 10 seconds. Another difference is that since there is a RTT delay inherent in this connection, you don't see much overlap once we hit the window size. Basically every request has enough of a delay so the we see a acknowledgement before sending the next TCP segment. So we tend to stay right at the Window edge rather than fluctuating, like we do in the baseline test.
TCPPerf Macro Code
You should be able to copy this into Excel's Macro Editor. The one problem I can foresee is that if formatting in your browser causes the text to wrap, Excel will complain. So keep this in mind.
A general overview of this code is that it copies the text from the clipboard and creates some columns to calculate UnACKed data and Advertised Window. We must also recalculate the Seq/Ack columns as there are not represented as numbers (they are numbers with hex in parens). Then we copy all the formulated data to another sheet so we can sort the resulting data. And finally we create a chart for the both sides of the conversation.
Sub TCPPerf()
' TCPPerf Macro
Application.ScreenUpdating = False
Application.Calculation = xlManual
' You can name your sheet different for multiple traces. The resulting
' sheet is created based on this name.
CurSheet = ActiveSheet.Name
' Populate the column headers
[A1].Value = "Frame"
[B1].Value = "Time"
[C1].Value = "TCPSeqData"
[D1].Value = "TCPAckData"
[E1].Value = "Window"
[F1].Value = "Len"
[G1].Value = "ConvID"
[H1].Value = "Source"
[I1].Value = "Dest"
[J1].Value = "Prot"
[K1].Value = "Desc"
[L1].Value = "Seq"
[M1].Value = "Ack"
[N1].Value = "Unack"
[O1].Value = "SrcData"
[P1].Value = "DstData"
[Q1].Value = "SrcWindow"
[R1].Value = "DstWindow"
[S1].Value = "AdvertisedWindow"
' Paste In Data from clipboard
Range("A2").Select
ActiveSheet.Paste
' Find Last Row in Data and save in LastRow
Range("A2").Select
Selection.End(xlDown).Select
Dim LastRow As Integer
LastRow = ActiveCell.Row
' Next take the text version of Seq/Ack from NM and convert to a number
Call SeqAckForm(LastRow)
' Create a column for UnAck'd data populate with calculation
Call UnAckData(LastRow)
' Create a column that gets the Src/Dest Seq and Advertised Window data
' depending on the sender.
Call SrcDestData(LastRow)
' Since we diabled calculations, cause one to occur now before we
' copy data around.
Calculate
' Define the name of the sheet we'll use to build our chart from
DataSheetName = "TCPPerf_" + CurSheet
' Transfer the data and calculated data to a new chart so we can sort.
Call TransferData(LastRow, CurSheet, DataSheetName)
' Build two charts, one for each client/server
Call BuildCharts(LastRow, DataSheetName)
Application.Calculation = xlAutomatic
Application.ScreenUpdating = True
End Sub
Sub SeqAckForm(LastRow)
'
' SeqAckForm Macro
'
' Just cut off the number at the first space and convert to a Number.
[L2].Value = "=VALUE(MID(RC[-9], 1, FIND("" "", RC[-9])))"
Range("L2").Select
Selection.AutoFill Destination:=Range("L2:L" & LastRow), _
Type:=xlFillDefault
[M2].Value = "=VALUE(MID(RC[-9], 1, FIND("" "", RC[-9])))"
Range("M2").Select
Selection.AutoFill Destination:=Range("M2:M" & LastRow), _
Type:=xlFillDefault
End Sub
Sub SrcDestData(LastRow)
' If the Source matches the first source, then take this seq, otherwise
' take the last value found.
[O2].Value = "=IF(H2=H$2, O1, M2)"
Range("O2").Select
Selection.AutoFill Destination:=Range("O2:O" & LastRow), _
Type:=xlFillDefault
' If the Source matches the first dest, then take this seq, otherwise
' take the last value we found.
[P2].Value = "=IF(H2=I$2, IF(P1<>0, P1, L2), M2)"
Range("P2").Select
Selection.AutoFill Destination:=Range("P2:P" & LastRow), _
Type:=xlFillDefault
' If the Source matches the first source, then take window to be the
' src window, otherwise take the last value we found.
[Q2].Value = "=IF(H2=H$2, Q1, E2)"
Range("Q2").Select
Selection.AutoFill Destination:=Range("Q2:Q" & LastRow), _
Type:=xlFillDefault
' If the Source matches the first dest, then take window to be the
' src window, otherwise take the last value we found.
[R2].Value = "=IF(H2=I$2, R1, E2)"
Range("R2").Select
Selection.AutoFill Destination:=Range("R2:R" & LastRow), _
Type:=xlFillDefault
' Now get the advertised window size from the other side based on which
' is the source address
[S2].Value = "=IF(H2=H$2, Q2, R2)"
Range("S2").Select
Selection.AutoFill Destination:=Range("S2:S" & LastRow), _
Type:=xlFillDefault
End Sub
Sub UnAckData(LastRow)
' Calculate the Unack'd data by looking at the seq/ack columns we created
' before and the len field.
[N2].Value = _
"=IF(IF(H2=H$2,L2+F2-O2,L2+F2-P2)<0,-1,IF(H2=H$2,L2+F2-O2,L2+F2-P2))"
Range("N2").Select
Selection.AutoFill Destination:=Range("N2:N" & LastRow), _
Type:=xlFillDefault
End Sub
Sub TransferData(LastRow, OriginalSheetName, DataSheetName)
' TransferData Macro
'
' Add a new sheet for new data and charts.
Sheets.Add
ActiveSheet.Name = DataSheetName
' Copy all of the various columns we need from the original sheet.
' This is done so that when we resort the data, we reference the
' formula results.
Sheets(OriginalSheetName).Select
Range("B1:B" & LastRow).Copy
Sheets(DataSheetName).Select
Range("A1").Select
ActiveSheet.Paste
Sheets(OriginalSheetName).Select
Range("F1:F" & LastRow).Copy
Sheets(DataSheetName).Select
Range("C1").Select
ActiveSheet.Paste
Sheets(OriginalSheetName).Select
Range("N1:N" & LastRow).Copy
Sheets(DataSheetName).Select
Range("D1").Select
Selection.PasteSpecial Paste:=xlPasteValues, Operation:=xlNone, _
SkipBlanks:=False, Transpose:=False
Sheets(OriginalSheetName).Select
Range("H1:H" & LastRow).Copy
Sheets(DataSheetName).Select
Range("E1").Select
ActiveSheet.Paste
Sheets(OriginalSheetName).Select
Range("L1:M" & LastRow).Copy
Sheets(DataSheetName).Select
Range("F1").Select
Selection.PasteSpecial Paste:=xlPasteValues, Operation:=xlNone, _
SkipBlanks:=False, Transpose:=False
Sheets(OriginalSheetName).Select
Range("A1:A" & LastRow).Copy
Sheets(DataSheetName).Select
Range("H1").Select
ActiveSheet.Paste
Sheets(OriginalSheetName).Select
Range("S1:S" & LastRow).Copy
Sheets(DataSheetName).Select
Range("B1").Select
Selection.PasteSpecial Paste:=xlPasteValues, Operation:=xlNone, _
SkipBlanks:=False, Transpose:=False
' Now sort this data by Source so we can split and create 2 charts.
Range("A1:I" & LastRow).Select
Selection.Sort Key1:=Range("E2"), Order1:=xlAscending, Header:=xlGuess, _
OrderCustom:=1, MatchCase:=False, Orientation:=xlTopToBottom, _
DataOption1:=xlSortNormal
End Sub
Sub BuildCharts(LastRow, MainSheetName)
' Find where the source changes to destination.
Range("A1:G1").Copy
For Each Cell In Range("E2:E" & LastRow)
If Cell.Value <> [E2] Then
Exit For
End If
Cell.Select
Next
' Paste in the original column headers
CurCellRow = Selection.Row + 1
Range(CurCellRow & ":" & CurCellRow).Insert Shift:=xlDown
' Create two names for each chart based on the the senders name.
ChartName1 = Range("E" & (CurCellRow - 1)).Value
ChartName2 = Range("E" & (CurCellRow + 2)).Value
Range("A1:D" & CurCellRow).Select
' Now create a chart for each address.
Call Chart(1, CurCellRow - 1, ChartName1, MainSheetName)
Call Chart(CurCellRow, LastRow + 1, ChartName2, MainSheetName)
End Sub
Sub Chart(FirstRow, LastRow, Name, MainSheetName)
' Set the range of the data we will use for our chart.
MinScale = Range(MainSheetName & "!A" & FirstRow + 1).Value
Sheets.Add
' Create a Name for this chart and set teh active sheet to that name.
TopUsersChart1Sheet = "Chart_" + Name + CurSheet
ActiveSheet.Name = TopUsersChart1Sheet
' Add in a new chart.
Charts.Add
ActiveChart.Location Where:=xlLocationAsObject, Name:=TopUsersChart1Sheet
ActiveChart.ChartType = xlXYScatterLines
ActiveChart.SetSourceData Source:= _
Range(MainSheetName & "!$A" & FirstRow & ":$D" & LastRow)
' Create a secondary access
ActiveChart.SeriesCollection(1).AxisGroup = 2
' Set the min/max scale based on the time in the first/last row.
ActiveChart.Axes(xlCategory).MinimumScale = _
Range(MainSheetName & "!A" & FirstRow + 1).Value
ActiveChart.Axes(xlCategory).MaximumScale = _
Range(MainSheetName & "!A" & LastRow).Value
' Make the min Y scale -1
ActiveChart.Axes(xlValue).MinimumScale = -1
' Make the long time lables slant a bit.
ActiveChart.Axes(xlCategory).TickLabels.Orientation = -25
End Sub
And Much More…
The general idea here is that you can take the TCP data and look at it in a graphic form to help you to see at a high level if there's a problem. There are so many other things that one could add. Resets could be added in to visually indicate those in the graph. You could also create other graphs to represent the seq/ack responses that would give you another view of the data. But hopefully this will give you a simple tool and some specific filters to spot check performance issues on your network.