Part 1: Poor Man’s Expert Using Excel – Top Users
One item we are evaluating for future versions of Network Monitor are experts. These are the tools that among other things, allow you to get a high level view of a problem. But using a simple new feature in the released version of NM3 will allow us to do some simple expert-like analysis.
Cut and Paste of Multiple Frame Summaries
NM3 allows you to select multiple frames, then right-click those frames and store the resulting output in the clipboard buffer. The resulting data is tab delimited and based on the columns you have showing in your frame summary. This is the key to creating simple experts with Excel. This TAB delimited data can be imported into Excel and manipulated to pull the information we want to summarize.
The Top Users Expert
The idea of this simple expert is to display the chattiest machines on your network. So it basically sorts the Source/Destination/Protocol fields and provides a count of each. This expert provides the top users that send and receive data. It also shows a protocol usage, but only at the top most level. So while this may not be as useful as a count of all protocols used, this still may help show where most of your bandwidth is being used protocol wise.
This expert can be useful to find a machine that is infected with a virus and attempting to pass that virus on to another machine. It can also identify a machine that is overloaded with requests and thus the center of a bottle neck.
How it works
You start by selecting the frames you want in NM3. Then right click those frames and select Copy. You could also just type Ctrl+C to copy these frames into the clipboard. Next you run Excel and paste the data, starting at line number 2. This is so we can add column headers for the data. Then you create 3 pivot tables, one each for Source/Destination/Protocol. For each pivot table, you select the appropriate column for the row data and row count. Once you do this you can sort the data, and the count of the highest users appears at the top.
Devil's in the Details
So rather than explaining each step, I'll annotate a Macro I created to do this job. If you cut and paste this macro into Excel and run, it will copy the data in the clipboard, and create the column labels, and then create a new page with the 3 pivot tables. NOTE: the data is assumed to be in the default layout (Frame Number, Time Offset, ConvID, Source, Destination, Protocol Name, Description). If you have a different layout, you'll have to modify the columns section in this macro.
This macro was created for Excel 2003. It should be easy to modify for future versions as well. In Excel 2003, I go to Tools, Macros. Then I typed in a name, TopUsers, and hit create. This gives me a blank macro, which you can populate with the following information.
Sub TopUsers()
' This creates the text for each column heading
' Match these to your column layout in NM3.
[A1].Value = "Frame"
[B1].Value = "Time"
[C1].Value = "ConvID"
[D1].Value = "Source"
[E1].Value = "Dest"
[F1].Value = "Protocol Name"
[G1].Value = "Description"
' Now make Cell A2 the current one and Past the clipboard results into Excel.
Range("A2").Select
ActiveSheet.Paste
' Get the range of all the data you've pasted in.
Dim CapRange As Range
Set CapRange = ActiveSheet.UsedRange
' You can name your sheet different for multiple traces. The resulting
' sheet is created based on this name.
CurSheet = ActiveSheet.Name
' Add a new sheet and define a variable for its name. Set it to the active sheet.
Sheets.Add
TopUsersSheet = "TopUsers_" + CurSheet
ActiveSheet.Name = TopUsersSheet
' Create Source Pivot Table
ActiveWorkbook.PivotCaches.Add(SourceType:=xlDatabase, SourceData:= _
CapRange).CreatePivotTable _
TableDestination:=TopUsersSheet + "!R3C1", TableName:="Source"
' Add Count of Source as xlCount of this Pivot Table.
ActiveSheet.PivotTables("Source").AddDataField ActiveSheet.PivotTables( _
"Source").PivotFields("Source"), "Count of Source", xlCount
' Add Source as xlRowField of this Pivot Table.
With ActiveSheet.PivotTables("Source").PivotFields("Source")
.Orientation = xlRowField
.Position = 1
End With
' Sort data based on the Count.
ActiveSheet.PivotTables("Source").PivotFields("Source").AutoSort _
xlDescending, "Count of Source"
' Create Dest Pivot Table, same as Source
ActiveWorkbook.PivotCaches.Add(SourceType:=xlDatabase, SourceData:= _
CapRange).CreatePivotTable _
TableDestination:=TopUsersSheet + "!R3C4", TableName:="Dest"
ActiveSheet.PivotTables("Dest").AddDataField ActiveSheet.PivotTables( _
"Dest").PivotFields("Dest"), "Count of Dest", xlCount
With ActiveSheet.PivotTables("Dest").PivotFields("Dest")
.Orientation = xlRowField
.Position = 1
End With
ActiveSheet.PivotTables("Dest").PivotFields("Dest").AutoSort _
xlDescending, "Count of Dest"
' Create Prot Pivot Table Same as Source
ActiveWorkbook.PivotCaches.Add(SourceType:=xlDatabase, SourceData:= _
CapRange).CreatePivotTable _
TableDestination:=TopUsersSheet + "!R3C7", TableName:="Protocols"
ActiveSheet.PivotTables("Protocols").AddDataField ActiveSheet.PivotTables( _
"Protocols").PivotFields("Protocol Name"), "Count of Prot", xlCount
With ActiveSheet.PivotTables("Protocols").PivotFields("Protocol Name")
.Orientation = xlRowField
.Position = 1
End With
ActiveSheet.PivotTables("Protocols").PivotFields("Protocol Name").AutoSort _
xlDescending, "Count of Prot"
' Label each of our tables.
[A2].Value = "Source Addresses"
[D2].Value = "Destination Addresses"
[G2].Value = "Top Protocols, highest level only"
End Sub
Adding a Button for Flare
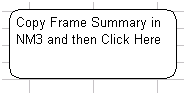
To make things even easier to use, I added a button on the main page. All it does is call the TopUsers macro. So you just copy the data in NM3, and click the button in Excel. Magically, the new sheet is populated with the table showing you the top users.
So to do this, I insert a picture. In my case I used an autoshape that looks like a rounded rectangle. But any picture will do, as long as you can assign a macro to it. To assign the macro, I just right clicked the shape and chose, Assign Macro. I also added some text to my rectangle like, "Copy Frame Summary in NM3 and then Click Here".

More to Come
While this is a simplistic expert, it should be possible to create more complicated ones. NM3 allows you to add columns to the interface. The columns you can choose are based on properties exposed the by the parsers. And you can go one step further by adding properties to the parsers. Stay tuned for a more complex example!