Software Metering Deep Dive and Automation Part 1: Use It Or Lose It - The Basics
Since the beginning of my involvement with Configuration Manager and SMS I have always considered and communicated with others the notion that software metering data can be used as a trigger mechanism for the removal of unused software. In other words, if software is not used, and this can be proven through software metering data, a system can be automatically placed into a collection that is targeted with a software removal package – use it or lose it. It occurred to me recently that I have never actually seen an example of software removal based on metering data in action. Furthermore with the introduction of System Center 2012 Orchestrator (surprise surprise), it also occurred to me that this removal process could now be crafted much more robustly, and the removal process much more diplomatic from the end user’s perspective.
In this blog post I will dig into The basics of Configuration Manager Software Metering System. I will very briefly demonstrate Software Metering rule creation, look at some data gathering and reporting (client on up to the database), and show how to speed the process using the 2012 Configuration Manager Toolkit for testing purposes. I will follow up this post with at least two additional postings. The first will dive into collection creation and how to use the metering data to place systems into a collection which can be targeted with an application uninstallation package. Shortly following that will be Post 3 in which I will loop in some Orchestrator Runbooks. These Runbooks will demonstrate metered software removal workflow such as providing end use notification and the ability to opt out of the software removal.
Links to Part 2 and 3 of this blog series:
- Software Metering Deep Dive and Automation Part 2: Use It Or Lose It - The Basics
- Software Metering Deep Dive and Automation Part 3: Use It Or Lose It - Orchestrator Integration
This should be a great series of posts which will not only focus on Software Metering, but will also encompass many different aspects of the new 2012 Configuration Manager system such as
- New collection membership types
- Use Device Affinity
- Application Deployment
- Integration with System Center Orchestrator
I hope you enjoy it, and as always, feedback is encouraged. Please feel free to leave a comment, rate the post, or contact me directly. Also subscribe to my Twitter feed for notification on all new posts to this blog. You can use the Twitter button fond on this page to do so.
Software Metering Basics:
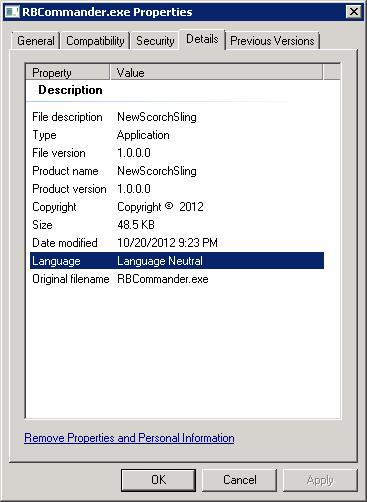
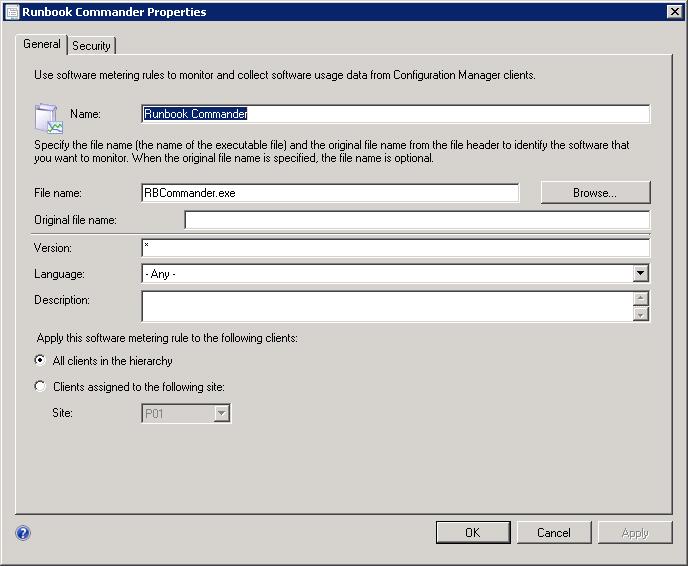
Software metering rules are not all that complicated to create. To create a metering rule simply right click on Software Metering from the Assets and Compliance node of the 2012 Configuration Manager console and select 'Create Software Metering Rule'. The few cautions would be to ensure that the file version and file language match exactly what is specified in the target .exe file properties; or to use wild cards. For instance if the desired metered application does not have the appropriate language specified on the file, or is language neutral, if English is selected in the metering rule, the software will not be metered.
Sample File Property - notice the language and file version (click image for better view):
Sample Software Metering Rule - note how the version and Language have been adjusted to match the file properties (click image for better view):
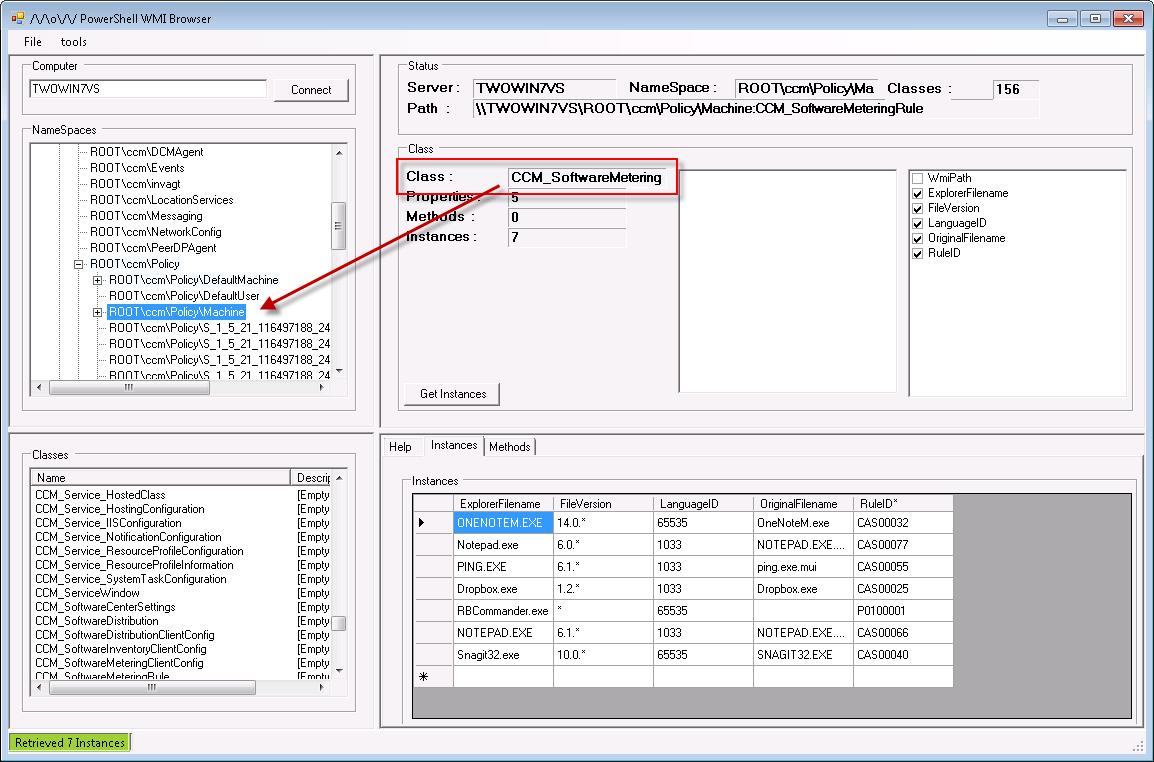
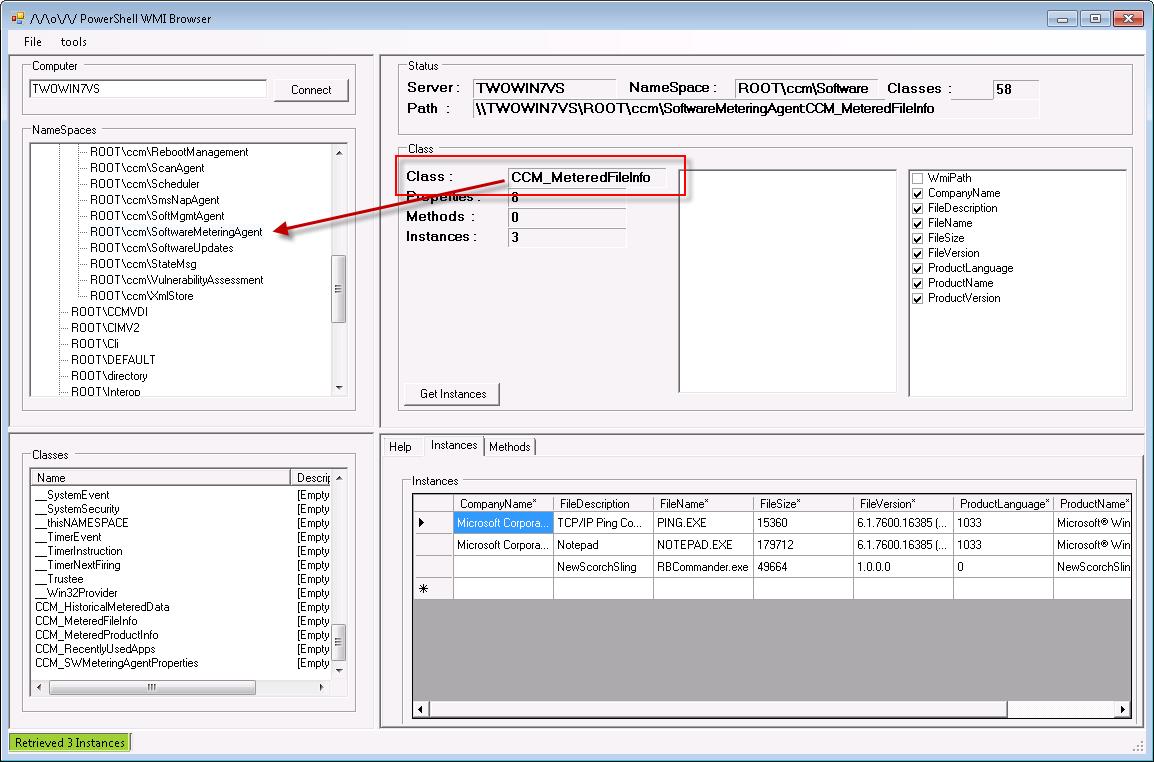
Unlike Software Distribution, Software Updates, and Compliance Settings Management, Software Metering Rules do not need to be deployed to a collection of computers or users. Once created and enabled, simply refresh machine policy on your target computer to enforce the rule. Once the client has received policy each metering rule is stored in the CCM_SoftwareMetering class of the Machine policy NameSpace. Similarly, information about each file associated with a metering rule can be found in the CCM_MeteredFileInfo class of the SoftwareMeteringAgent NameSpace.
CCM_SoftwareMetering example showing all Software Metering Rules enabled in my Lab environment (click image for better view):
CCM_MeteredFileInfo Sample (click image for better view):
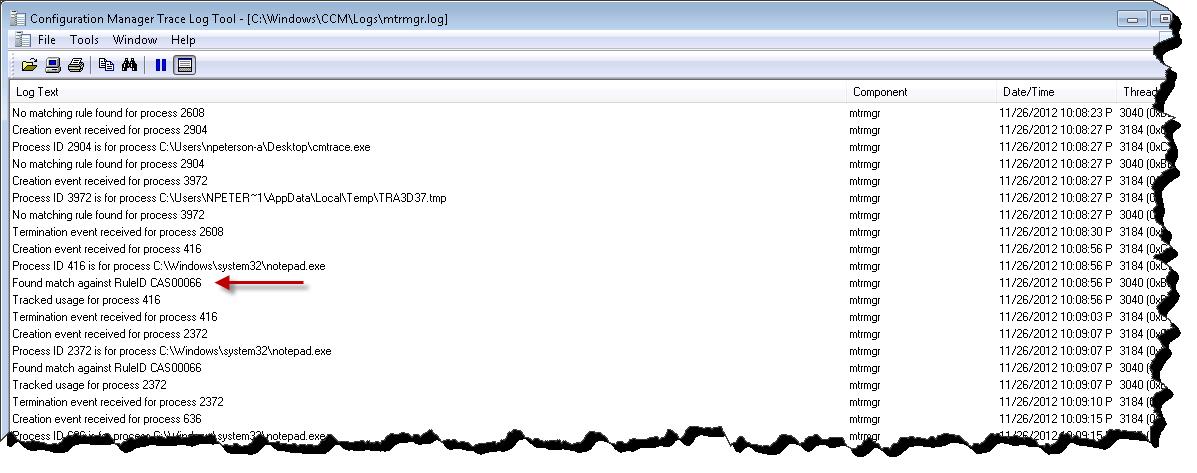
With an understanding of how the metering rule arrives client side, and where the innards are stored, we can now observe the metering process as it is carried out. If we take a peek inside of the MTRMGR.LOG and then launch the metered application, we will see that a matching rule has been found and that the usage is being tracked. Note the RuleID, this was also observed in the CCM_SoftwareMeteringRules class and will come in handy in part to of this blog series.
mtmgr.log Sample (click image for better view):
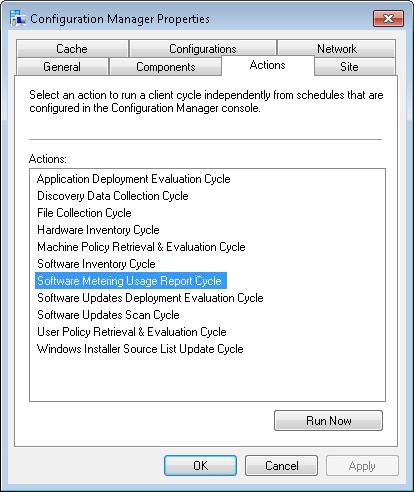
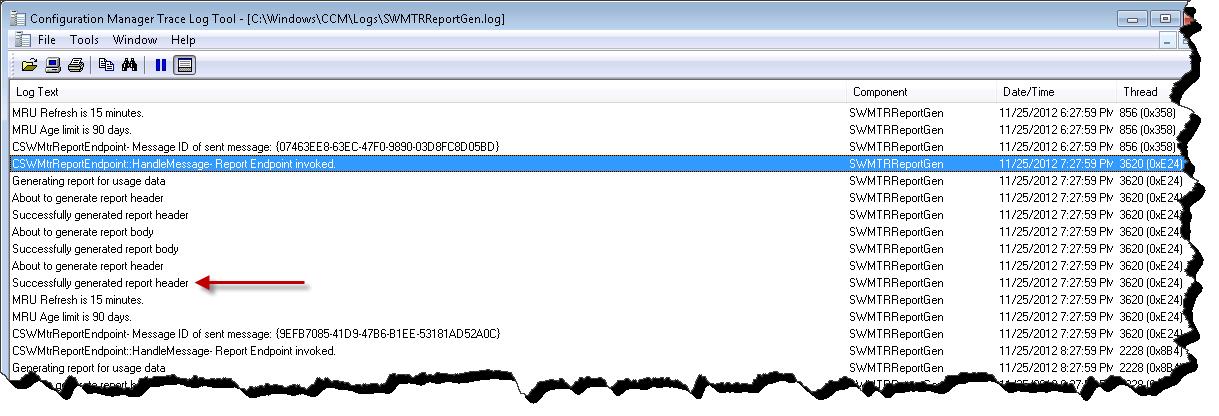
Finally on the client end, the metered software data needs to be reported back to the Configuration Manager application. This is scheduled in the Software Metering Client Agent and can also be manually triggered using ‘Software Metering Usage Report Cycle’ from the Configuration Manager Control Panel. This process will be logged in the SWMTRReportGen.log .
Control Panel Application:
SWMTRReportGen.log Sample (click image for better view):
Summarizing and Reporting on the Data:
Before we can report on or use metering data in a collection query, there are two server side ‘Summarize Software Metering Usage Data’ Site Maintenance tasks that must be executed. These are by default configured to execute once a day. Once completed, the metered data is stored in the Configuration Manager database in a usable form.
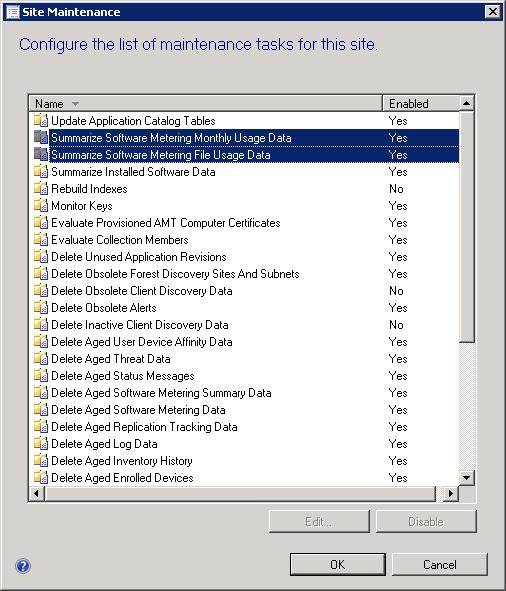
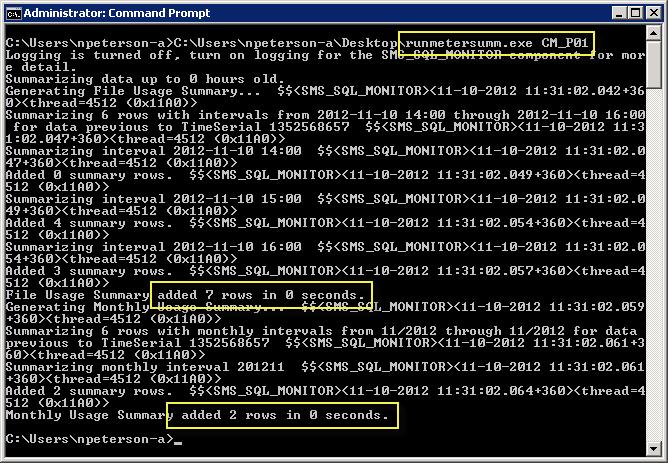
What you will notice is that there is no manual method that can be used in console to execute either of these maintenance tasks. If you would like to speed up this process or trigger this process manually for testing / development purposes grab a copy of the Configuration Manager 2012 Toolkit from the following location – System Center 2012 – Configuration Manager Component Add-ons and Extensions. Once installed, you will find a file under the Server Tools folder named runmetersumm.exe. This file can be executed on the SQL instance hosting the Configuration Manager database and will trigger the summarization process. The execution string is 'runmetersumm.exe DBName' and this process can be observed in the swmproc.log file on the site server.
Example execution of runmetersumm.exe (click image for better view):
Now that we have metered data collected and summarized, we can observe the collected and summarized metering data using any of the reports provided with the Configuration Manager application, as well as use this data in any collection query rule.
Conclusion:
In this brief posting I have taken a peak into the basics of Software Metering. We have seen an example Software Metering Rule and discussed a few gotchas that can arise with Rule creation. I’ve then demonstrated how to view the metering process using client side logging and WMI data, and how to manually initiate the transfer of this data from the client to the site server for process. I’ve finally demonstrated how to manually trigger the two summarization jobs using the runmetersumm.exe application found in the 2012 Configuration Manager toolkit. The intent of this post was to lay down the basic foundation for software metering. Check back in the coming days for the follow up postings in which we will put this data to use.