Performance Monitor Tips and Tricks with John Rodriguez
Hello everyone … My name is John Rodriguez, and I'm a Principal PFE based in Minneapolis, MN. I'm also one of Neil's frequent collaborators, particularly on load simulation tools. When he wrote his recent article on performance analysis of Jetstress data, I suggested that he include some of our time-saving tips. He's a busy chap, and asked me to write the article instead. So, to that end, I'm here as a guest contributor to share with you some of the things we as performance specialists do within Perfmon. [Neil: Actually John taught me Exchange perf when I first joined Microsoft in 2007 and again when I went through MCM; it is a great honour to have him write stuff for my blog, so thanks again John J].
If you spend a lot of time in Perfmon, whether for general performance analysis, reviewing Jetstress data, or trying to identify the source of a bottleneck, you tend to look for ways to automate tasks – to simplify things. Thankfully Perfmon provides some extremely useful interfaces which provide us with our time-saving opportunities.
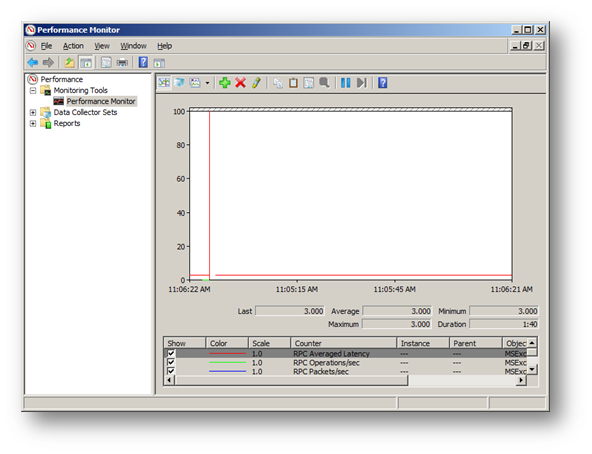
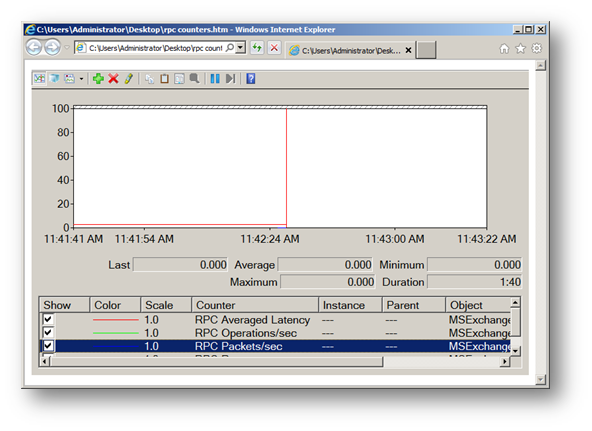
When you first launch Performance Monitor, and switch to the Performance Monitor node, you should see the general screen with a single counter (usually Processor(_Total)\% Processor Time). In the example below, I've deleted the default counter and added four specific ones of great Exchange importance: MSExchangeIS\RPC Averaged Latency, \RPC Operations/sec, \RPC Packets/sec, and \RPC Requests.
How did I add those counters? Believe it or not, I pasted them. Pasted? Into Perfmon? Really? Yes, really. Here's how.
When you first launch Perfmon and want to add counters, you can click the green Plus symbol, or right-click the display and select "Add Counters…" as shown below.
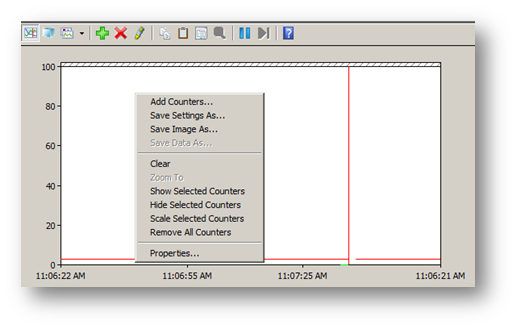
Now, if you look at the context menu, you can see an option to "Save Settings As…" This is one of the most underappreciated items in Perfmon, and enables a lot of incredibly useful behavior. "Save Settings As" predictably enough saves the existing set of counters to an HTML file which you can then open and edit to your heart's content. If you right-click the file and select Open With > Notepad, you should see a bunch of entries beginning with <PARAM NAME="Counter#" and then details on the counters themselves, like so:
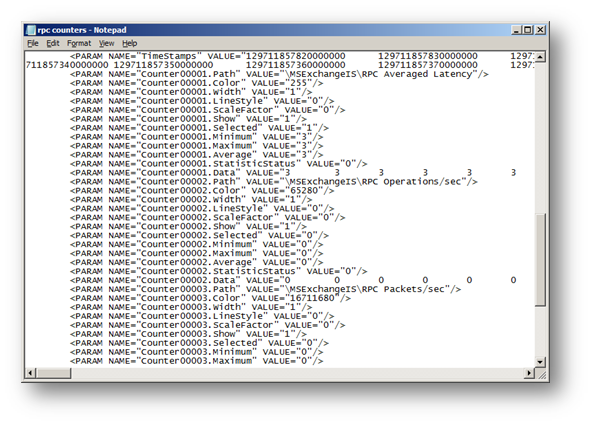
[It's important to select Open With > Notepad, rather than double-click on the file. We'll see why in a minute.]
Notice that there's no server name in this data – the value is just the counter name – "\MSExchangeIS\RPC Averaged Latency", "\MSExchangeIS\RPC Packets/sec", and so on. This means that this set is rather portable – to our great advantage. I can use this information to automatically add a whole group of counters to Perfmon at once. But we're not going to load them from the file – we're going to paste them into Perfmon! This may sound odd, but Perfmon actually supports copy-and-paste. If I want to add all of those counters at once, I can simply open that HTML file with Notepad, copy the contents (select all, copy), open Perfmon, click anywhere in the right-hand pane, and then click Ctrl-V, Perfmon will add all of those counters at once. In other words, if you add the counters to one server, and save the settings to HTML, you can quickly add all of those counters for any other server! This is extremely useful, but we're only just getting started.
Now that we have our settings file (in my case, "rpc counters.htm"), we can perform a few little tricks. First, since it's HTML, we can actually open this settings file with Internet Explorer. Unless you've weakened the security settings for IE, you'll need to click "Allow blocked content", but do that and you see Perfmon embedded within Internet Explorer:
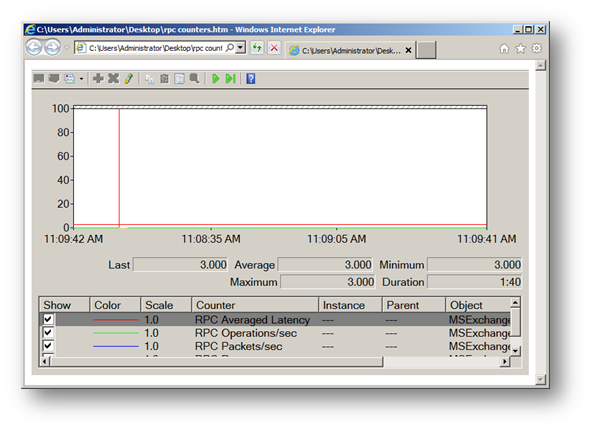
Notice that Perfmon includes not just the counter list I added before, but visible data points as well (which was saved in the settings file). But more importantly, this is a fully functioning instance of Perfmon. Notice the two green buttons in the menu bar at the top of the Perfmon instance – the one on the left (similar to the "Play" button on a CD or DVD player) switches the display to live data, while the second (the "Skip Forward" button) leaves the display paused but updates the data to the present moment.
The green "Play" button has changed to a blue "Pause" button, and many of the other buttons have also been enabled as well (including add and remove counters).
"This is nice," you may say to yourself, "but what good does it do?" Well, for one thing, you can select a specific set of counters, save the settings file, and then distribute the settings file to your teammates so that they can open that same set of counters. This is very useful if you have a large set of counters and want to make sure that everyone's looking at the same data.
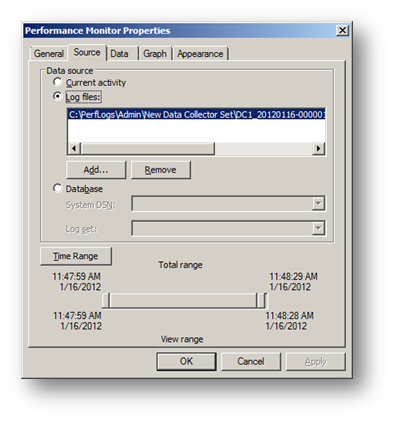
Where the "Save Settings As" option really becomes useful is when you're working with performance logs (BLG files). In this case, I've captured performance data using a custom Data Collector Set, and the results of the data are saved in C:\Perflogs\Admin\New Data Collector Set\DC1_datetime.log. I switched back to the Performance Monitor tab, and selected View Log Data from the action menu (you can also press Ctrl+L to do the same thing).
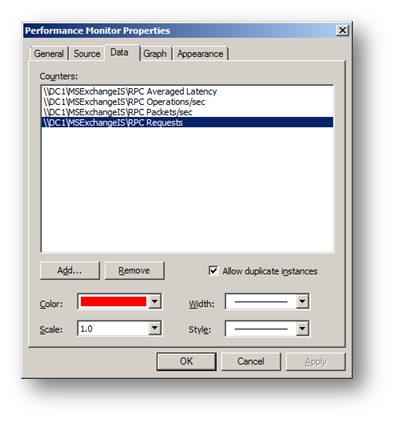
On the Data tab, I select all four counters from the log file and add them into the list to display.
Because I don't have very much data in the BLG, the resulting display isn't terribly exciting. But it's not the display that I'm concerned with here – it's what I can do with the data I selected. Again, I right-click and select "Save Settings As" and save the list of counters to another HTML file. [Side note: when you select "Save Settings As" when viewing data from a BLG, other options become available, including Save Data As, which gives you the option to reduce the size of an existing BLG by saving only a subset of data points.]
However, when you open this second HTML file, you'll notice that things look a little different. The counter names are prefaced by the server name:
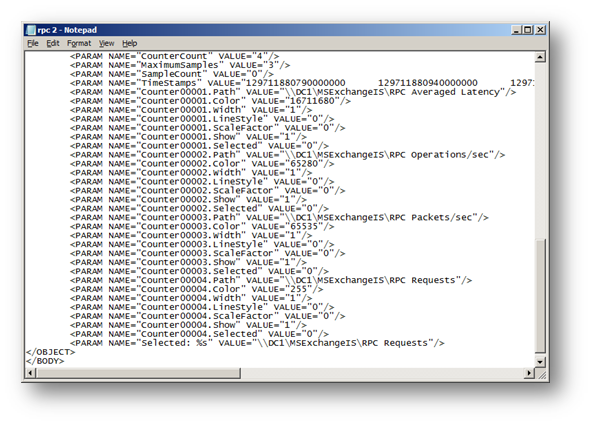
My lab machine is named DC1, but if I want to use this on a performance log I collected from DC2, all I need to do is a simple find-and-replace in the HTML file, open the appropriate saved log (View Log Data), and then perform the same copy/paste trick listed above. Again, Perfmon will add all of the relevant counters directly into the display. That means that you can create the list of counters once and use that same list for every single BLG you want to review. Just change the name of the server within the HTML file for each server, then paste the contents.
To summarize, Perfmon allows you to save and load sets of performance counters, and you can use this functionality to make your performance life a little easier. By saving the settings to disk, you can ensure that you use the same list every time, even if you've closed Perfmon. You can launch Perfmon from within Internet Explorer using a saved settings file, which helps ensure consistency so that everyone uses the same counters. Last, you can use a settings file as a template to view the same set of counters from different BLG files from different servers.
Hopefully these tricks help you become more efficient in your use of Perfmon. Let us know in the comments!