Analysing Exchange Server 2010 Jetstress BLG Files By Hand
Quite often when I am working through Jetstress escalations I will ask to see the BLG files from the test. These files contain performance counter information that was logged during the test run and they show us a lot more about what is really going on than the data in the report HTML files.
To keep this post short, let's assume that you have already read through the Jetstress Field guide and move on to the fun stuff straight away J
Why Analyse the BLG file by hand?
Given that Jetstress already parses the BLG files and searches for various counters and values, why on Earth would we ever need to look in the BLG file ourselves? There are a number of reasons..
Establish failure severity
Was the failure caused by a single event, or do the performance logs show prolonged and repetitive issues? This is often useful when trying to put together a resolution plan – can we fix this by adding a few extra spindles or are we going to need a significantly bigger storage solution?
Analyse failure mode scenarios
When we test for failure modes, such as disk controller failure etc. the test may fail due to one very high latency spike, however as long as the test resumes in an acceptable timeframe and performance is acceptable we would conclude that the test passed even though Jetstress reported it as failed.
Finding the Jetstress test BLG File
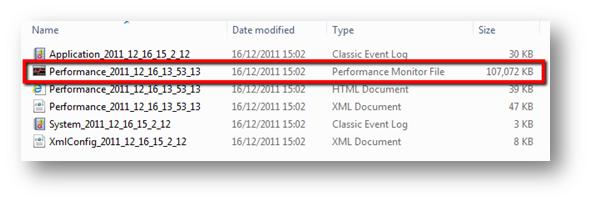
Jetstress defaults to storing all test data in the folder in which it was installed. When you look in that folder you are looking for files of type Performance Monitor File. Given that you are probably not going to perform this analysis on the Exchange server, make a copy of the file to your workstation.
Hint:
BLG files are generally very compressible, so if you need to copy them over a WAN it is worth compressing them first.
Opening the Jetstress test BLG File in Performance Monitor
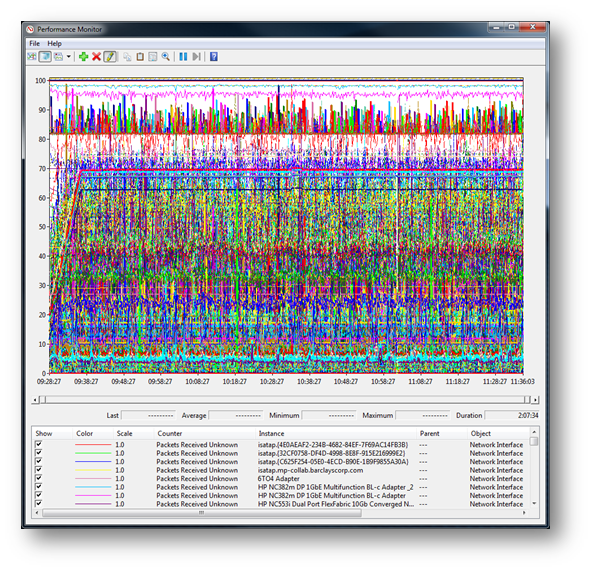
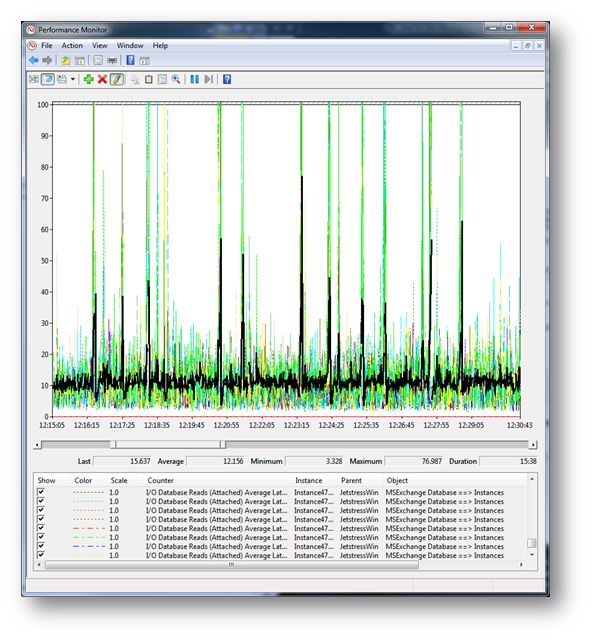
For this section I am going to assume that you have access to a Windows 7 workstation. One of the most frequent mistakes that I see people make at this stage is to simply double click on the BLG file… this will automatically open the trace file in perfmon and open the top 50 counters… firstly this takes ages and secondly it looks like this… which as you can see is pretty busy and pretty useless…
So, instead we are going to open Performance monitor and then open our BLG files. Performance monitor is stored in the Administrative Tools section of your start menu…
- Start -> All Programs -> Administrative Tools -> Performance Monitor
Once Performance Monitor has started…
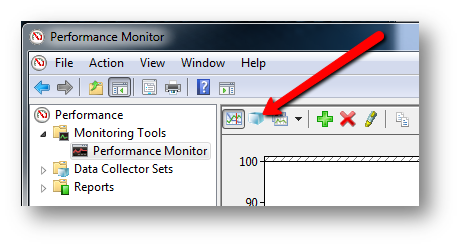
- Select Performance Monitor under the Monitoring Tools section
- Click on the View Log Data icon
- Check the Log Files radio button, then click Add
- Select the Jetstress BLG that you want to analyse
- Click OK
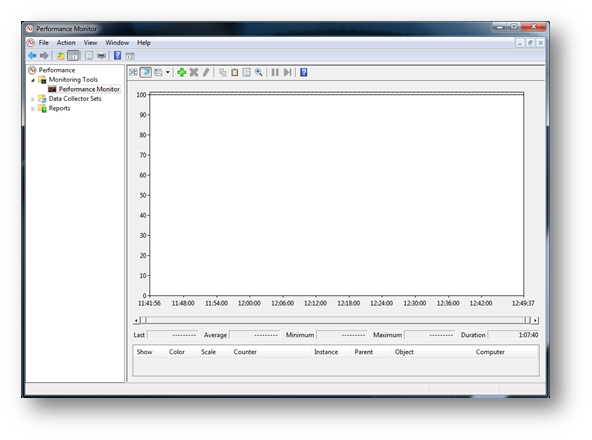
You should now be looking at a totally empty Performance Monitor page…
Analysing the Jetstress Performance Data
Now we have Performance Monitor open and our Jetstress BLG file attached, the next step is to begin looking at the data. Before we begin this it is worth a quick recap of the counters and objects that we are interested in during an Exchange 2010 Jetstress test.
The best place to read about Exchange 2010 performance counter values is here:
The following values are of specific interest when analysing Jetstress performance files.
Counter |
Description |
Threshold |
MSExchange Database Instances(*) \I/O Database Reads (Attached) Average Latency |
Shows the average length of time, in ms, per database read operation. |
Should be <20 ms on average. Less than 6 spikes >100ms |
MSExchange Database Instances(*) \I/O Log Writes Average Latency |
Shows the average length of time, in ms, per Log file write operation. |
Should be <10ms on average. Less than 6 spikes >50ms |
MSExchange Database(JetstressWin) \Database Page Fault Stalls/sec |
Shows the rate that database file page requests require of the database cache manager to allocate a new page from the database cache. |
If this value is nonzero, this indicates that the database isn't able to flush dirty pages to the database file fast enough to make pages free for new page allocations. |
MSExchange Database(JetstressWin) \Log Record Stalls/sec |
Shows the number of log records that can't be added to the log buffers per second because the log buffers are full. If this counter is nonzero for a long period of time, the log buffer size may be a bottleneck. |
The average value should be below 10 per second. Spikes (maximum values) shouldn't be higher than 100 per second. |
Examples
The following are from some recent example tests.
Normal Jetstress test results
Before we move on to more interesting data I thought it would be useful to show what good test data looks like…
Database Read Latency
The following chart shows the MSExchange Database Instances (*)\I/O Database Reads (Attached) Average Latency values for the test. In this instance it is clear that all instances average is below 20ms and there are no read latency spikes. I have discarded checksum instances since they are not required. The _Total instance is highlighted in black and is discussed below.
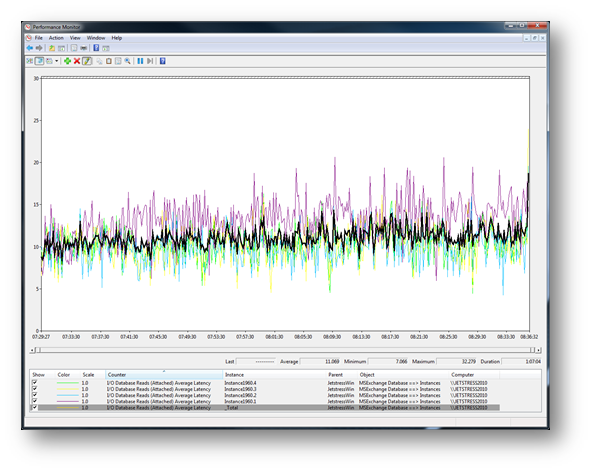
I often see people quoting the _total instance for database read latencies. The _total instance is simply an average across all observations for that point in time and so serves no purpose other than to obscure the latency peak values.
The default Jetstress sample time is 15s which is already too large in my opinion (I recommending dropping this down to 2s for manual analysis – edit the XML to do this) so using an average value across all instances usually serves to make the results look better than they really are.
In the example above I have highlighted the _Total instance to show how it flattens out the results. Do not use the _total instance; it will often hide latency spikes from your results.
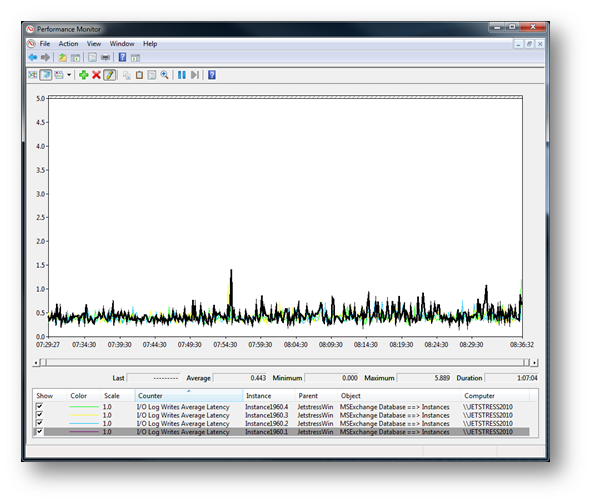
Log Write Latency
This chart shows the MSExchange Database Instances (*)\I/O Log Writes Average Latency. As you can see the results show that the write latency values are way below the 10ms average and there are no spikes.
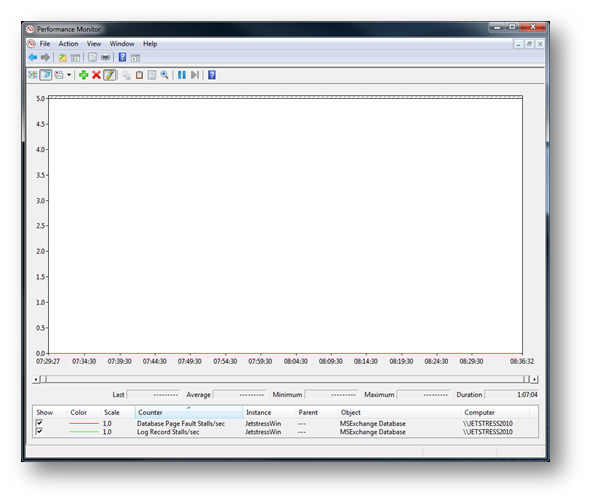
Log Record and Page Fault Stalls
This chart shows both Log Record Stalls/Sec and Database Page Fault Stalls/Sec. As you can see both counters recorded 0 stalls/sec during the test which shows that the storage was able to meet the demands required by the database.
Failure Mode Test – Disk Controller Failure
The following test data came from an Exchange 2007 deployment where the customer was performing failure mode analysis of their storage. This specific test simulated a failure of a disk controller within their storage subsystem. The expected behaviour is to experience a brief storage outage and then for I/O to continue as normal. Manual analysis was required for this test since Jetstress just shows a failure due to average latency being >20ms.
The following charts show the recorded BLG data, it clearly shows that the test was actually in good shape apart from a single event caused by the simulation of the disk controller module. This event caused an I/O outage of 60 seconds, which was recorded as 4 x 20,000ms spikes on the chart. These few, very high values were enough to skew the average latency values of the test. In reality this test showed that the storage is capable of recovering from a disk controller failure in an acceptable time and the performance after the failure is the same as it was before.
Although Jetstress reports this as a failed run, I classified this as a test pass since the storage solution recovered from the failure quickly and resumed operations at the same level of performance. The operations team are now aware what a failure of this module will look like for Exchange and how long it will take to recover.
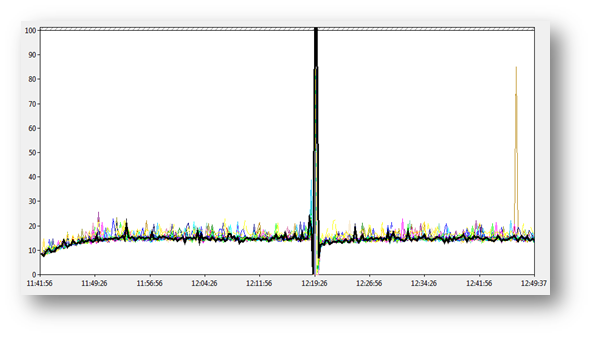
Figure 1: Database Read Latency
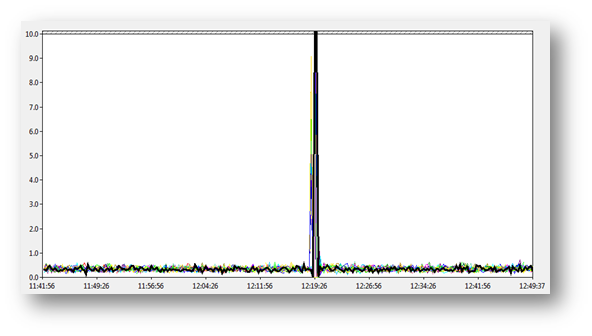
Figure 2: Log File Write Latency
Jetstress Log Interval Time Case
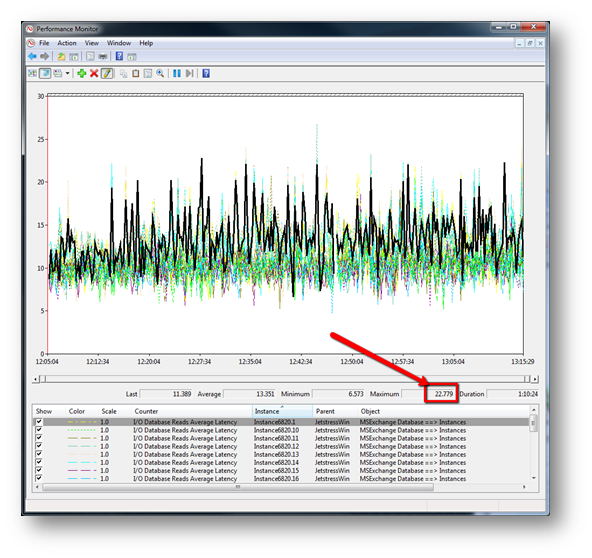
This is an interesting example since the initial Jetstress test actually passed the storage solution, however the team involved were suspicious since they had previous experience with this deployment and knew that it reported storage problems when analysed via SCOM or the PAL tool. When Jetstress passed the storage they began further analysis…
This is the DB read latency from their first test with the Jetstress log interval set to the default of 15s. Nothing unusual to report and Jetstress passed the test. The chart looks good and the maximum latency values are all below 100ms.
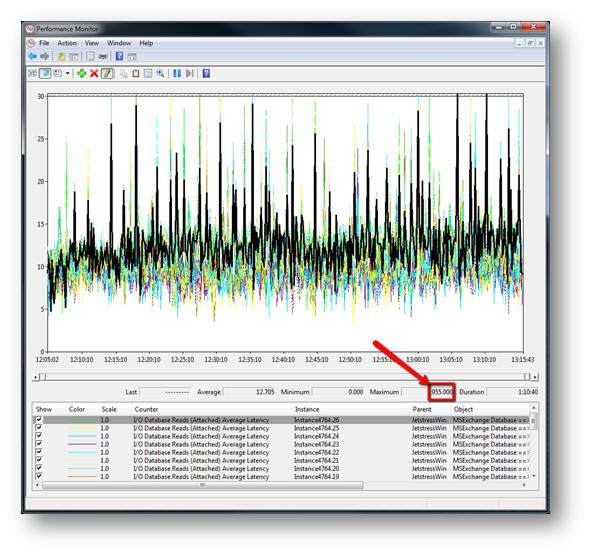
The team were concerned by this and decided to reduce the log interval time within the Jetstress test XML file.
<LogInterval>15000</LogInterval>
Was changed to
<LogInterval>1000</LogInterval>
This reduced the sample interval time from 15s to 1s. The team then re-ran the test.
This chart shows the test data for the run with the LogInterval reduced to 1s. It is clear that something is different – the average values seem fine, however the maximum values are way over 100ms suggesting latency spikes - Jetstress failed the test due to disk latency spikes.
If we zoom in to this chart a little to get a closer look it is evident that there are a significant number of read latency spikes over 100ms during this 15 minute zoomed in window. Further analysis suggests that these spikes are observed throughout the test. The initial run with log interval set to 15s had totally missed these latency spikes.
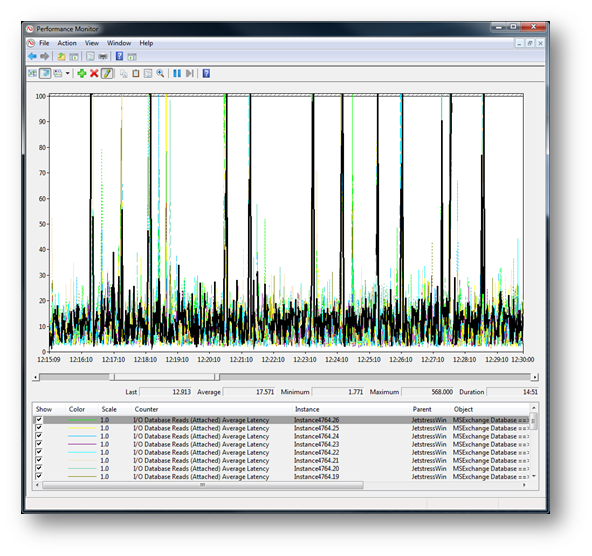
Just in case my point about using the _Total instance wasn't clear earlier in this post I decided to add it in and highlight it on this example. Even though it is clear that this test is suffering from significant read latency spikes, the _Total instance (Highlighted in black) is smoothing this out and hiding those 100ms+ spikes. If you were only looking at the _Total instance you would have missed this issue, even with the reduced LogInterval time.
Conclusion and summary
Manual analysis of Jetstress test data is not always required, however it is often useful, especially if the storage platform is new to your organisation and you want to get a better understanding of how it is performing under load.
Manual analysis of test data during failure mode testing is very highly recommended. It is critically important that you understand how component failure will affect your storage performance under normal working conditions. The only way to do this is to take a look at the BLG data that was logged during these tests and assessing if that behaviour is acceptable for your deployment.
The default log interval time of 15s can mask instantaneous latency spikes. In most test cases this is not a problem, however I recommend that you reduce the log interval time down to between 2-5s where more granular data logging is desired; this is especially useful if you are using a shared storage platform or are using some form of advanced storage solution (Direct Attached Storage rarely requires this reduction in sample interval).
Note:
Reducing the LogInterval time in your Jetstress configuration XML file will significantly increase the size of your BLG file. A 2hr test at 2s interval will create an 800MB BLG file. This also has an impact on your ability to work with the data. Performance monitor can suffer from significant slowdown with very large BLG files.