What to know about Exchange 2013 Managed Availability and SCOM Part 1 - Architecture
Disclaimer: Due to changes in the MSFT corporate blogging policy, I’m moving all of my content to the following location. Please reference all future content from that location. Thanks.
Based on my initial work with Exchange 2013 and Managed Availability with SCOM, I suspect I’ll be making a few posts on this matter. If you’ve worked at all with monitoring Exchange with SCOM, then you know it can present a unique set of challenges. The Exchange management packs have historically been rather chatty, causing lots of noise that needs to be tuned out in order to monitor. Apparently, the Exchange team was also not fond of this, as they completely redid monitoring for Exchange 2013. From what I understand, this was born out of a dev-ops model, where the Exchange team was also the primary support for ExchangeOnline. There are pros and cons to this. The big thing to keep in mind is that this means that may of the default monitoring settings are geared towards the ExchangeOnline environment.
First, let’s start with the architecture. I’m not a guru here, so this is a very basic summary, and it’s coming from the perspective of a person who has done some Exchange Administration/Engineering work, but who is primarily works with System Center. I’ve attached a few links as well that I think are well worth reviewing, as they will give you a very good idea on how it works.
https://blogs.technet.com/b/exchange/archive/2013/08/13/customizing-managed-availability.aspx
https://www.youtube.com/watch?v=5H0LwIvwSis
The big change is that the Exchange team has centralized Exchanged monitoring inside of Exchange. The previous architecture is that most of the monitoring was achieved via the SCOM Management Pack for Exchange. As well, this management pack installed a service on the management server called the Correlation Engine which stepped in between Exchange and SCOM, processed data, and then generated alerts in SCOM. For those familiar with Exchange 2010 and SCOM, this presented its own set of challenges towards monitoring the environment. As such, the Exchange team decided to central is.
On the plus side, this mean Exchange is responsible for all monitoring settings. It does force your Exchange engineers to be much more attached to the monitoring process, something that isn’t always easy to do. The other nice thing is that Exchange has the ability to correct actions on the fly, which is very useful in large enterprise environments.
The down side though is that it defeats the purpose of having a centralized monitoring system. As you will see in this post and in future posts, the architecture of the system essentially takes SCOM out of the picture. You can no longer configure monitoring thresholds in SCOM (other than turning on or off the SCOM monitor), and the time it takes for some of these items to post to the correct log that SCOM is monitoring is excessive (meaning you may have a database is down for 20 plus minutes before SCOM generates an alert).
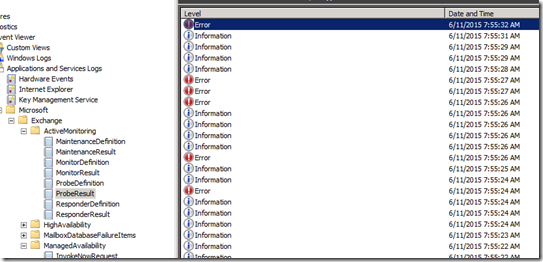
Managed Availability is essentially broken down into 3 areas, all of which are heavily tied to the Exchange logs in the event viewer (also known as crimson logs). The three areas are Probes, Monitors, and Responders. Managed availability starts by executing probes on a very frequent basis. In a decent sized environment, these can number in the thousands making checks each second. It’s a lot. These are stored in the Probe Result crimson log:
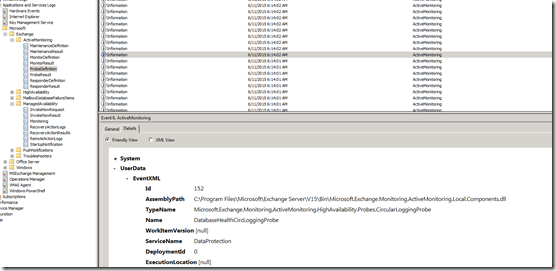
The definitions of a probe are also a bit different (as with Monitors). These are stored in the ProbeDefinition Log. If you want to find something in this log, use a find feature for the particular item you are looking for, as traditional event log filtering doesn’t quite do the job (for me at least). Note that the details view has the information you need as this is essentially an XML file with various attributes. You can see from the screenshot below that this probe is looking at Circular Logging. There’s a number of properties, some of which can be overridden via Exchange PowerShell.
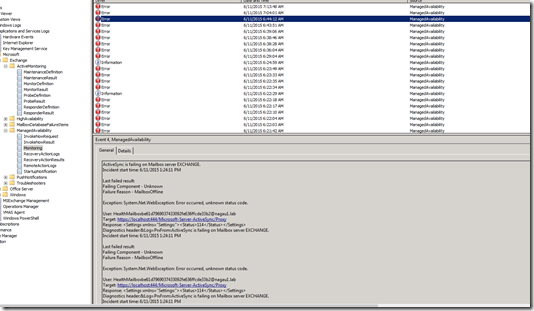
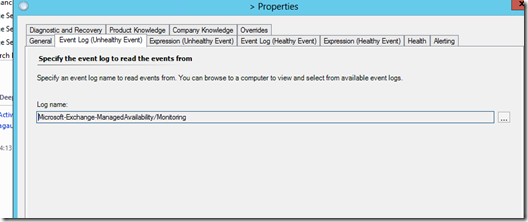
The same is true with Monitor Results and Monitor Definitions. These are stored in the Microsoft\Exchange\ActiveMonitoring folder in event viewer. The monitors essentially watch the probes. When a probe fires, this will trigger a monitoring response. You’ll see the particular Monitor and its threshold in the MonitoringDefinition Log. You’ll see alerts generated by the monitor in the Monitoring Result log. This is all correlated in Exchange, and that process, as of this writing, is essentially a big black box to me. Hopefully, I’ll be able to get the information needed to explain how that works and post another blog on it. Eventually, the results from monitors make their way to the Managed Availability\Monitoring Log.
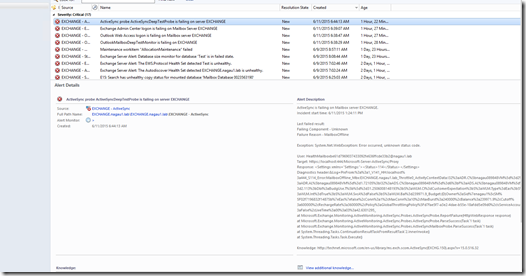
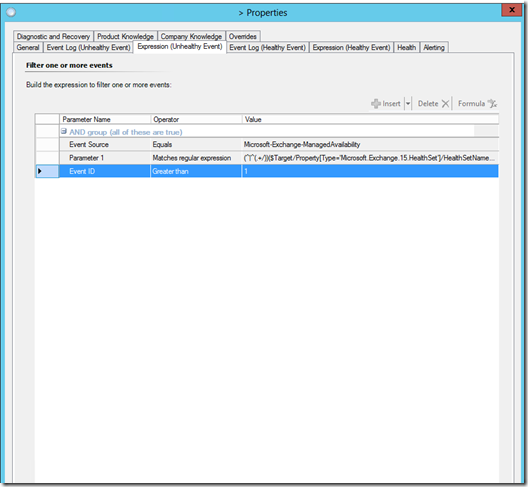
This is where SCOM gets its information. Once an alert fires in this log, you’ll see a SCOM alert shortly.
You can see this from the properties of the particular monitor:
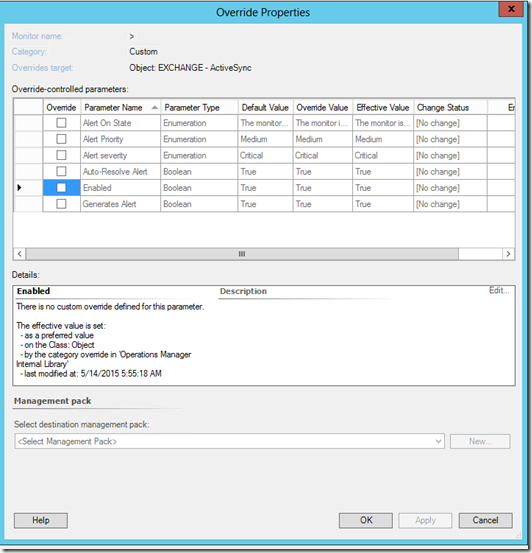
And for the real fun, this is what you can change in SCOM.
As you can see, not much. You can turn it on/off. Change the ability to generate an alert, auto-resolve, priority, and severity. Pretty simple SCOM stuff. The actual thresholds themselves are going to be handled in Exchange. The next parts of this series are going to dive into this in a lot more detail. In the mean time, familiarize yourself with those links above as they cover how to do this.
Technorati Tags: Managed Availability,SCOM,Exchange 2013,Monitoring,Overrides
