Unpacking RAP as a Service for Active Directory: Leveraging the On-Demand Assessment
Summary : Bryan Zink , a Senior Microsoft Premier Field Engineer based in the US, continues his exploration into RAP as a Service for Active Directory, the exciting new toolset and offering from Microsoft Services, and provides us details on how to leverage the RAP as a Service toolset on an on-going basis. This is the last part of a three part series from Bryan. Enjoy!
 Bryan here, this is part 3 of 3 in the series. The RAP as a Service-AD service comes with a toolset that carries a re-use license. As of the writing of this article, the specifics are spelled out in your Microsoft Premier Support agreement and your Technical Account Manager can provide additional insight. We’ve published a short video titled “Microsoft RAP as a Service” that if you haven’t seen, it’s well worth the 2 minutes and 20 seconds. Take a look now:
In this short video, we reference the fact that you can check up on things whenever you “feel iffy.” Let me put that in slightly different terms. Now that your RAP as a Service–AD delivery is complete and you received Microsoft’s recommendations, you probably want to check up on things to ensure they’ve been remediated. Also, you’ll want to know if anything new creeps in that may cause issues. Let’s perform an On-Demand Assessment.
Getting an updated toolset
Not only are new issues and associated rules added to the analysis process but Microsoft also will update and release new RAP as a Service Client versions from time to time. The update process is fairly straight forward.
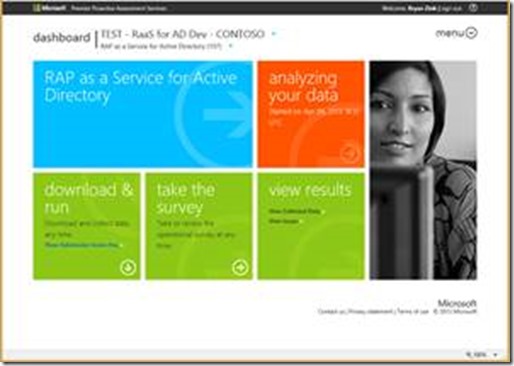
Step 1: Sign-in to the Online Services portal and choose the download & run link and save the new client locally.
Step 2: Get the new client installed. Uninstall any existing version you may have and then install what you’ve just downloaded.
Recollect and Resubmit
Reaching back to part 2 in this series, now it’s time to perform an updated data collection and submission. Make sure you also go back through the Operational Survey to answer any new questions along with update any previous answers that may have changed. This will ensure the cleanest view of the current state of your Active Directory environment.
You can repeat this process as frequently as you’d like. If you find yourself thinking “Hey, maybe I should do this every day”, then we may need to discuss System Center Operations Manager and Desired Configuration Monitoring. Daily submissions may be a little too frequent. Maybe weekly at first or possibly monthly is a better frequency. How often really is dependent upon how close attention you pay to the moving parts of Active Directory.
Checkout the Issues and Recommendations
Hopefully this is not a surprise to you at this point but you have the ability to recollect, resubmit and then track issues in your environment through the Online Services portal. This is what we describe as the Persistent On Demand Assessment experience. It is valuable. We’ve purposely put these tools and assessment results into your hands to empower you to have quicker and deeper insight into the Risk and Health issues in your Active Directory environment.
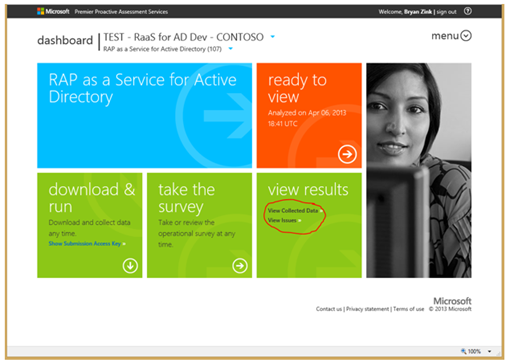
From the Online Services portal, you’ll notice two important links in the view results box (View Collected Data and View Issues).
Much like it sounds, View Collected Data gives you a visualization of all the collected data from your Active Directory environment. Likewise, View Issues gives you the latest list of Issues from the last data submission.
View Collected Data
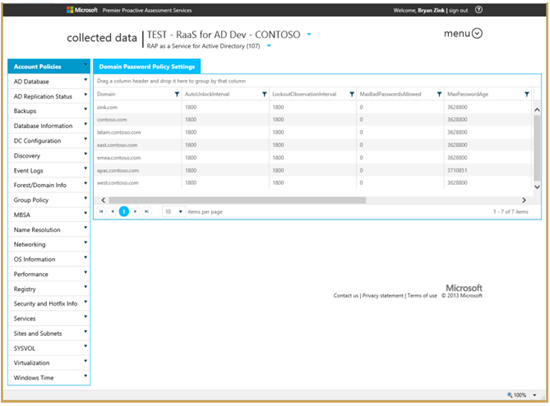
From time to time, exactly HOW the data is displayed may change. As we identify improvements, implement suggestions from engineers and customers and generally find better ways of displaying content, changes will occur. As of this blog post, here’s the latest and greatest view of the collected data.
Almost all of the data across all of the scenarios (formerly called Test Cases under the RAP brand) is sortable and filterable to make it more dynamic in terms of seeing what you want to see in order to follow what’s happening.
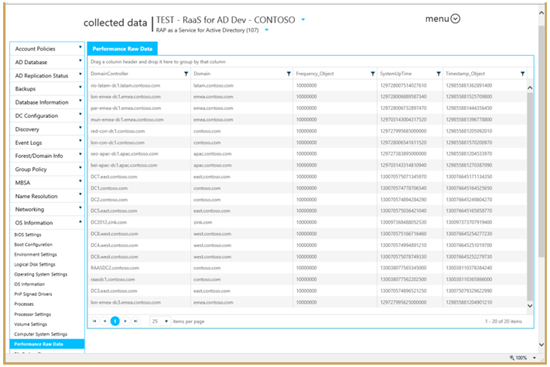
Short of writing about all of the possible combinations of search criteria, filter options and displayed data, the best bet is to just dig in and start looking at what we have. For example, suppose you want to check and see what the System Uptime is across all of your DCs forest-wide. To do this, expand the OS Information scenario, then choose Performance Raw Data and look at the SystemUpTime column.
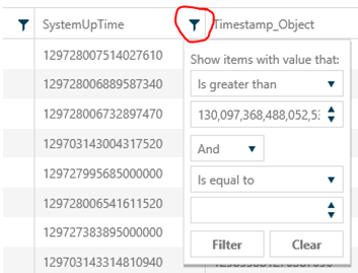
Now suppose you wanted to see ONLY those DCs that have been up longer than 20 days. You would choose the filter icon at the top of the SystemUpTime column and choose “is greater than” and enter 172800 (because it’s in seconds) and then select Filter.
Now go play around with this a little and see what you’ve got in your environment.
View Issues
OK, let’s be honest. Knowing what the Microsoft Expert Analysis system sees in your environment is probably what you want to know first. Right?
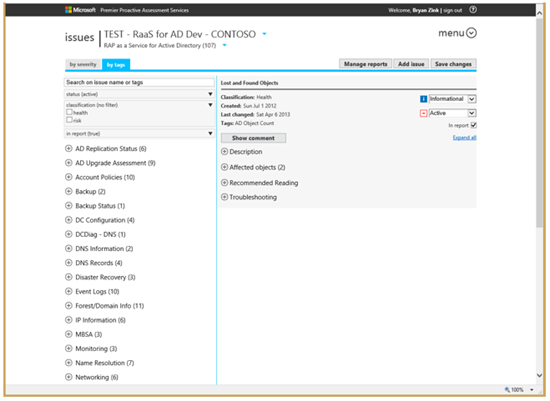
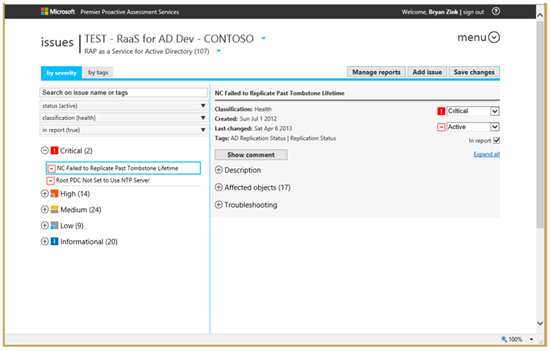
There are several different “views” of the issues that you’ll want to get familiar with. First, it’s important to know the difference in viewing by Severity versus viewing by Tags. Severity seems pretty obvious. All of the Issues are listed by the level of severity. Tags though allow you to zero in on the specific functional areas of Active Directory. Viewing by Severity is probably where you’ll go first but as you start to track your remediation of issues, you’ll probably spend time in the Tags view to see just what changes impact different areas of Active Directory.
Next, we provide the ability to view based on issue status. Is it Active (a current issue), Inconclusive (not really sure, maybe we failed on a data collection task) or Resolved (already been corrected). Most likely, you won’t care too much about watching what’s been resolved. So you’ll probably filter by Active issues most of the time.
We also provide the ability to differentiate between Health and Risk issues. While it’s easy to separate some issues into Health versus Risk, some issues may be a little more subjective. You’ll have to play around here to get the best sense of where you’ll find certain items. Generally though, Risk is an item that may have an impact whereas Health represents something that is already a problem. Think AD is failing to replicate somewhere versus having STRICT REPLICATION CONSISTENT enabled or not.
Filtering by whether an issue is visible in the report or not really only matters to the initial engineer assessing the environment with you. In other words, you can probably ignore this filter.
Pulling it all together
Here’s Bryan’s personal approach to seeing just what’s going on. If you build and follow a similar plan of action, you will maintain a Healthier, more reliable Active Directory environment.
Step 1: Start by viewing the severity of all health issues.
Step 2: Work from CRITICAL down towards INFORMATIONAL. Making note of issues that may be related paying close attention to the affected objects. This will help you see patterns that may be causing a cascading effect.
Step 3: Take notes on items that you want to go and take corrective action on. Being respective of existing Change Management processes you have in your environment. Remember, unplanned or undocumented change is typically the cause of >72% of all IT system outages.
Step 4: Fully document your action plan, vet it through your peers, submit it to Change Management (or take action as required).
Step 5: Rinse and repeat.
OK, time for me to check out and get to work. As you can see, this Active Directory environment is in need of some hands on remediation.
Bryan
Article written by Bryan Zink , Sr. Premier Field Engineer; posted by Frank Battiston , MSPFE Editor
