How to Create a Graphical Event Log Viewer with PowerShell
In a follow-up to his popular post on How To Create Video Games Using PowerShell, Jeff Adkin, a Microsoft Premier Field Engineer based in Canada, gets back to business and shows us how to use PowerShell to graphically represent information gathered over time from the Windows Event Log. Enjoy!
In my article, How To Create Video Games Using PowerShell, someone asked me “Is it possible to pull reports on things like Security Audit from PowerShell and present them graphically? ” I thought this was a great question and an incredible way of looking at graphical uses for PowerShell, so I went ahead and created something like this to assist me with checking Event logs.
Event Logs are great but what these lacked that I needed was a way to see how often a specific error occurred over a period of time in a quick and easy format. So I opened up Notepad and began creating my own solution for Event Statistics. In this article, I’ll show you how I accomplished this by using PowerShell to create a form and used Excel functions to create our Charts for us.
The Design Phase
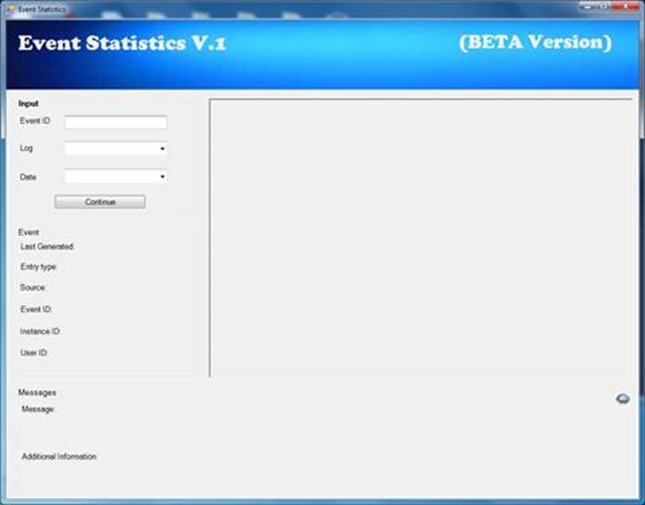
Designing, always the fun part. So what do we need to actually pull the correct logs as well as a place to display information? I decided on the following fields.
Form: (Our form to hold everything)
Input Section: (For all the input fields we need)
Event ID – Textbox for input
Log – Drop down box to control 3 areas in beta (Application, System and Security)
Date – Drop down box for the date range being pulled.
Event Section: (For our display of pulled information)
Last Generated:
Entry Type:
Source:
Event ID:
Instance ID:
User ID:
I then added a messages section and Additional information to be able to show everything the Event Logs would.
Last but not least we needed to add a CONTINUE button to run the scripts after input was finalized. This was all great but I also wanted to see the results graphically, so I added a good sized PictureBox for our graphical results.
The end result after Form creation:
I decided that the best tool to use to create our graphical chart would be Excel. Excel, like many programs, allows us to run its functions from inside a PowerShell script.
The Coding Phase
So I have what it looks like but I still need to create all my objects and the Form. So, starting from the beginning:
 [void][System.Reflection.Assembly]::LoadWithPartialName("System.Windows.Forms")

 [void][System.Reflection.Assembly]::LoadWithPartialName("System.Drawing")

 #-- Form1 ---------------------------------------------------------------------

 $Form1 = New-Object System.Windows.Forms.Form

 $Form1.BackgroundImageLayout = [System.Windows.Forms.ImageLayout]::None

 $Form1.ClientSize = New-Object System.Drawing.Size(1069, 809)

 $Form1.FormBorderStyle = [System.Windows.Forms.FormBorderStyle]::Fixed3D

 $Form1.Text = "Event Statistics"

 #region$Form1.BackgroundImage = ([System.Drawing.Image](...)

 $Form1.BackgroundImage = ([System.Drawing.Image]([System.Drawing.Image]::FromStream((New-Object System.IO.MemoryStream(($$ = [System.Convert]::FromBase64String(

 "/9j/4AAQSkZJRgABAQEAYABgAAD/4QBoRXhpZgAATU0AKgAAAAgABAEaAAUAAAABAAAAPgEbAAUA"+"AAABAAAARgEoAAMAAAABAAIAAAExAAIAAAASAAAATgAAAAAAAABgAAAAAQAAAGAAAAABUGFpbnQu"+"TkVUIHYzLjUuMTAA/9sAQwAQCwwODAoQDg0OEhEQExgoGhgWFhgxIyUdKDozPTw5Mzg3QEhcTkBE"+"V0U3OFBtUVdfYmdoZz5NcXlwZHhcZWdj/9sAQwEREhIYFRgvGhovY0I4QmNjY2NjY2NjY2NjY2Nj"+ "Y2NjY2NjY2NjY2NjY2NjY2NjY2NjY2NjY2NjY2NjY2NjY2Nj/8AAEQgAdwQyAwEiAAIRAQMRAf/E"+…
(NOTE* The Background image is in Base64. Condensed here as example only)
 #-- Label14 -------------------------------------------------------------------

 $Label14 = New-Object System.Windows.Forms.Label

 $Label14.Font = New-Object System.Drawing.Font("Cooper Black", 18.0, [System.Drawing.FontStyle]::Regular, [System.Drawing.GraphicsUnit]::Point, ([System.Byte](0)))

 $Label14.Location = New-Object System.Drawing.Point(384, 73)

 $Label14.Size = New-Object System.Drawing.Size(317, 29)

 $Label14.TabIndex = 14

 $Label14.Text = "Loading... Please Wait..."

 $Label14.BackColor = [System.Drawing.Color]::Transparent

 $Label14.ForeColor = [System.Drawing.Color]::DarkRed

 $Label14.visible = $false

 #-- Label15 -------------------------------------------------------------------

 $Label15 = New-Object System.Windows.Forms.Label

 $Label15.Font = New-Object System.Drawing.Font("Cooper Black", 15.75, [System.Drawing.FontStyle]::Regular, [System.Drawing.GraphicsUnit]::Point, ([System.Byte](0)))

 $Label15.Location = New-Object System.Drawing.Point(61, 73)

 $Label15.Size = New-Object System.Drawing.Size(409, 26)

 $Label15.TabIndex = 15

 $Label15.Text = "Statistics for Event ID"

 $Label15.BackColor = [System.Drawing.Color]::Transparent

 $Label15.ForeColor = [System.Drawing.SystemColors]::ButtonFace

 $Label15.Visible = $false

 #-- Label13 -------------------------------------------------------------------

 $Label13 = New-Object System.Windows.Forms.Label

 $Label13.Font = New-Object System.Drawing.Font("Cooper Black", 24.0, [System.Drawing.FontStyle]::Regular, [System.Drawing.GraphicsUnit]::Point, ([System.Byte](0)))

 $Label13.Location = New-Object System.Drawing.Point(759, 20)

 $Label13.Size = New-Object System.Drawing.Size(282, 48)

 $Label13.TabIndex = 13

 $Label13.Text = "(BETA Version)"

 $Label13.BackColor = [System.Drawing.Color]::Transparent

 $Label13.ForeColor = [System.Drawing.SystemColors]::ButtonFace

 #-- Label12 -------------------------------------------------------------------

 $Label12 = New-Object System.Windows.Forms.Label

 $Label12.Font = New-Object System.Drawing.Font("Cooper Black", 26.25, [System.Drawing.FontStyle]::Regular, [System.Drawing.GraphicsUnit]::Point, ([System.Byte](0)))

 $Label12.Location = New-Object System.Drawing.Point(15, 20)

 $Label12.Size = New-Object System.Drawing.Size(599, 53)

 $Label12.TabIndex = 12

 $Label12.Text = "Event Statistics V.1"

 $Label12.BackColor = [System.Drawing.Color]::Transparent

 $Label12.ForeColor = [System.Drawing.SystemColors]::ButtonFace

 #-- GroupBox3 -----------------------------------------------------------------

 $GroupBox3 = New-Object System.Windows.Forms.GroupBox

 $GroupBox3.Font = New-Object System.Drawing.Font("Microsoft Sans Serif", 9.75, [System.Drawing.FontStyle]::Regular, [System.Drawing.GraphicsUnit]::Point, ([System.Byte](0)))

 $GroupBox3.Location = New-Object System.Drawing.Point(12, 621)

 $GroupBox3.Size = New-Object System.Drawing.Size(1047, 179)

 $GroupBox3.TabIndex = 10

 $GroupBox3.TabStop = $false

 $GroupBox3.Text = "Messages"

 #-- Label11 -------------------------------------------------------------------

 $Label11 = New-Object System.Windows.Forms.Label

 $Label11.Location = New-Object System.Drawing.Point(13, 108)

 $Label11.Size = New-Object System.Drawing.Size(999, 57)

 $Label11.TabIndex = 1

 $Label11.Text = "Additional Information: "

 #-- Label10 -------------------------------------------------------------------

 $Label10 = New-Object System.Windows.Forms.Label

 $Label10.Location = New-Object System.Drawing.Point(13, 28)

 $Label10.Size = New-Object System.Drawing.Size(1005, 61)

 $Label10.TabIndex = 0

 $Label10.Text = "Message: "

 $GroupBox3.Controls.Add($Label11)

 $GroupBox3.Controls.Add($Label10)

 #-- GroupBox2 -----------------------------------------------------------------

 $GroupBox2 = New-Object System.Windows.Forms.GroupBox

 $GroupBox2.Font = New-Object System.Drawing.Font("Microsoft Sans Serif", 9.75, [System.Drawing.FontStyle]::Regular, [System.Drawing.GraphicsUnit]::Point, ([System.Byte](0)))

 $GroupBox2.Location = New-Object System.Drawing.Point(12, 351)

 $GroupBox2.Size = New-Object System.Drawing.Size(307, 254)

 $GroupBox2.TabIndex = 9

 $GroupBox2.TabStop = $false

 $GroupBox2.Text = "Event"

 #-- Label9 --------------------------------------------------------------------

 $Label9 = New-Object System.Windows.Forms.Label

 $Label9.Location = New-Object System.Drawing.Point(11, 203)

 $Label9.Size = New-Object System.Drawing.Size(245, 31)

 $Label9.TabIndex = 5

 $Label9.Text = "User ID: "

 #-- Label8 --------------------------------------------------------------------

 $Label8 = New-Object System.Windows.Forms.Label

 $Label8.Location = New-Object System.Drawing.Point(10, 167)

 $Label8.Size = New-Object System.Drawing.Size(248, 24)

 $Label8.TabIndex = 4

 $Label8.Text = "Instance ID: "

 #-- Label7 --------------------------------------------------------------------

 $Label7 = New-Object System.Windows.Forms.Label

 $Label7.Location = New-Object System.Drawing.Point(11, 130)

 $Label7.Size = New-Object System.Drawing.Size(249, 24)

 $Label7.TabIndex = 3

 $Label7.Text = "Event ID: "

 #-- Label6 --------------------------------------------------------------------

 $Label6 = New-Object System.Windows.Forms.Label

 $Label6.Location = New-Object System.Drawing.Point(10, 93)

 $Label6.Size = New-Object System.Drawing.Size(249, 20)

 $Label6.TabIndex = 2

 $Label6.Text = "Source: "

 #-- Label5 --------------------------------------------------------------------

 $Label5 = New-Object System.Windows.Forms.Label

 $Label5.Location = New-Object System.Drawing.Point(11, 58)

 $Label5.Size = New-Object System.Drawing.Size(250, 26)

 $Label5.TabIndex = 1

 $Label5.Text = "Entry type: "

 #-- Label1 --------------------------------------------------------------------

 $Label1 = New-Object System.Windows.Forms.Label

 $Label1.Location = New-Object System.Drawing.Point(11, 24)

 $Label1.Size = New-Object System.Drawing.Size(286, 25)

 $Label1.TabIndex = 0

 $Label1.Text = "Last Generated: "

 $GroupBox2.Controls.Add($Label9)

 $GroupBox2.Controls.Add($Label8)

 $GroupBox2.Controls.Add($Label7)

 $GroupBox2.Controls.Add($Label6)

 $GroupBox2.Controls.Add($Label5)

 $GroupBox2.Controls.Add($Label1)

 #-- GroupBox1 -----------------------------------------------------------------

 $GroupBox1 = New-Object System.Windows.Forms.GroupBox

 $GroupBox1.Font = New-Object System.Drawing.Font("Microsoft Sans Serif", 9.75, [System.Drawing.FontStyle]::Bold, [System.Drawing.GraphicsUnit]::Point, ([System.Byte](0)))

 $GroupBox1.Location = New-Object System.Drawing.Point(12, 134)

 $GroupBox1.Size = New-Object System.Drawing.Size(307, 197)

 $GroupBox1.TabIndex = 8

 $GroupBox1.TabStop = $false

 $GroupBox1.Text = "Input"

 #-- Button1 -------------------------------------------------------------------

 $Button1 = New-Object System.Windows.Forms.Button

 $Button1.Font = New-Object System.Drawing.Font("Microsoft Sans Serif", 9.75, [System.Drawing.FontStyle]::Regular, [System.Drawing.GraphicsUnit]::Point, ([System.Byte](0)))

 $Button1.Location = New-Object System.Drawing.Point(70, 162)

 $Button1.Size = New-Object System.Drawing.Size(154, 24)

 $Button1.TabIndex = 8

 $Button1.Text = "Continue"

 $Button1.UseVisualStyleBackColor = $true

 $Button1.add_Click({Button1Click($Button1)})

 #-- Label2 --------------------------------------------------------------------

 $Label2 = New-Object System.Windows.Forms.Label

 $Label2.Font = New-Object System.Drawing.Font("Microsoft Sans Serif", 9.75, [System.Drawing.FontStyle]::Regular, [System.Drawing.GraphicsUnit]::Point, ([System.Byte](0)))

 $Label2.Location = New-Object System.Drawing.Point(10, 29)

 $Label2.Size = New-Object System.Drawing.Size(59, 21)

 $Label2.TabIndex = 5

 $Label2.Text = "Event ID"

 #-- Label4 --------------------------------------------------------------------

 $Label4 = New-Object System.Windows.Forms.Label

 $Label4.Font = New-Object System.Drawing.Font("Microsoft Sans Serif", 9.75, [System.Drawing.FontStyle]::Regular, [System.Drawing.GraphicsUnit]::Point, ([System.Byte](0)))

 $Label4.Location = New-Object System.Drawing.Point(10, 124)

 $Label4.Size = New-Object System.Drawing.Size(58, 15)

 $Label4.TabIndex = 7

 $Label4.Text = "Date"

 #-- ListBox1 ------------------------------------------------------------------

 $ListBox1 = New-Object System.Windows.Forms.ComboBox

 $ListBox1.Font = New-Object System.Drawing.Font("Microsoft Sans Serif", 9.75, [System.Drawing.FontStyle]::Regular, [System.Drawing.GraphicsUnit]::Point, ([System.Byte](0)))

 $ListBox1.FormattingEnabled = $true

 $ListBox1.ItemHeight = 16

 $ListBox1.Location = New-Object System.Drawing.Point(87, 119)

 $ListBox1.Size = New-Object System.Drawing.Size(174, 20)

 $ListBox1.TabIndex = 3

 $ListBox1.Items.AddRange([System.Object[]](@("Last 7 days", "Last 14 days", "Last 30 days", "Last 60 days", "Last 90 days")))

 #-- Label3 --------------------------------------------------------------------

 $Label3 = New-Object System.Windows.Forms.Label

 $Label3.Font = New-Object System.Drawing.Font("Microsoft Sans Serif", 9.75, [System.Drawing.FontStyle]::Regular, [System.Drawing.GraphicsUnit]::Point, ([System.Byte](0)))

 $Label3.Location = New-Object System.Drawing.Point(10, 75)

 $Label3.Size = New-Object System.Drawing.Size(59, 17)

 $Label3.TabIndex = 6

 $Label3.Text = "Log"

 #-- Logfile -------------------------------------------------------------------

 $Logfile = New-Object System.Windows.Forms.ComboBox

 $Logfile.Font = New-Object System.Drawing.Font("Microsoft Sans Serif", 9.75, [System.Drawing.FontStyle]::Regular, [System.Drawing.GraphicsUnit]::Point, ([System.Byte](0)))

 $Logfile.FormattingEnabled = $true

 $Logfile.ItemHeight = 16

 $Logfile.Location = New-Object System.Drawing.Point(87, 72)

 $Logfile.Size = New-Object System.Drawing.Size(174, 20)

 $Logfile.TabIndex = 2

 $Logfile.Items.AddRange([System.Object[]](@("Application", "System", "Security")))

 #-- InstanceID ----------------------------------------------------------------

 $InstanceID = New-Object System.Windows.Forms.TextBox

 $InstanceID.Font = New-Object System.Drawing.Font("Microsoft Sans Serif", 9.75, [System.Drawing.FontStyle]::Regular, [System.Drawing.GraphicsUnit]::Point, ([System.Byte](0)))

 $InstanceID.Location = New-Object System.Drawing.Point(87, 29)

 $InstanceID.Size = New-Object System.Drawing.Size(174, 22)

 $InstanceID.TabIndex = 1

 $InstanceID.Text = ""

 $GroupBox1.Controls.Add($Button1)

 $GroupBox1.Controls.Add($Label2)

 $GroupBox1.Controls.Add($Label4)

 $GroupBox1.Controls.Add($ListBox1)

 $GroupBox1.Controls.Add($Label3)

 $GroupBox1.Controls.Add($Logfile)

 $GroupBox1.Controls.Add($InstanceID)

 #-- Chart ---------------------------------------------------------------------

 $Chart = New-Object System.Windows.Forms.PictureBox

 $Chart.BackgroundImageLayout = [System.Windows.Forms.ImageLayout]::Stretch

 $Chart.BorderStyle = [System.Windows.Forms.BorderStyle]::Fixed3D

 $Chart.Location = New-Object System.Drawing.Point(343, 134)

 $Chart.Size = New-Object System.Drawing.Size(716, 471)

 $Chart.SizeMode = [System.Windows.Forms.PictureBoxSizeMode]::StretchImage

 $Chart.TabIndex = 0

 $Chart.TabStop = $false

 $Chart.Text = ""

 Now that we have the Objects created we need to add these to the Form itself:

 $Form1.Controls.Add($Label14)

 $Form1.Controls.Add($Label15)

 $Form1.Controls.Add($Label13)

 $Form1.Controls.Add($Label12)

 $Form1.Controls.Add($GroupBox3)

 $Form1.Controls.Add($GroupBox2)

 $Form1.Controls.Add($GroupBox1)

 $Form1.Controls.Add($Chart)
We now have our own fully formed and ready Graphical User Interface for our program. We don’t have any code to actually run yet so we should probably add our functions next.
Functions
Functions, functions, functions, where would we be without functions? Truth is, as pretty as we can make any GUI it’s useless without the functions to actually make it do something. In this case we are going to start at the bottom of the script to ensure we have our beginning functions set up.
At the bottom of the script:
 function Main{

 [System.Windows.Forms.Application]::EnableVisualStyles()

 [System.Windows.Forms.Application]::Run($Form1)

 }

 function PictureBox1Click( $object ){

 $xl.speech.speak("Speech review functionality is not currently completed. Thank you.")

 }

 function Button1Click( $object ){
 if ($instanceid.text -ne $null){RunIt}
 write-host $logfile.text

 }

 Main
So we have our Opening of the script with our Form creation and the end of the script for our Main function and our “If you click the button” function which calls RunIt. The RunIt function is the function we will need to use to pull everything and create the Charts for us.
 function RunIt{

 $lo = $logfile.value

 #Clear all Old values if there are any

 $chart.image = $null

 $label1.text = "Last Generated: "

 $label5.text = "Entry Type: "

 $label6.text = "Source: "

 $label7.text = "Event ID: "

 $label8.text = "Instance ID: "

 $label9.text = "User ID: "

 $label10.text = "Message: "

 $label11.text = "Additional Information: "

 $ev = $instanceid.text

 #Set up initial Excel

 $xrow = 1

 $yrow = 2

 $global:xl = New-Object -c excel.application

 $wb = $xl.workbooks.add()

 $sh = $wb.sheets.item(1)

 $q = 1

 #Get the EventLog informationto write to our Fields

 if($ListBox1.text -eq "Last 7 days"){$num = 7}

 if($ListBox1.text -eq "Last 14 days"){$num = 14}

 if($ListBox1.text -eq "Last 30 days"){$num = 30}

 if($ListBox1.text -eq "Last 60 days"){$num = 60}

 if($ListBox1.text -eq "Last 90 days"){$num = 90}

 $event = Get-EventLog -LogName $logfile.text | where { $_.EventID -eq $ev} | select -First 1

 $id = $event.instanceid

 $label1.text += $event.timegenerated

 $label5.text += $event.Entrytype

 $label6.text += $event.source

 $label7.text += $event.eventid

 $label8.text += $event.instanceid

 $label9.text += $event.username

 $label10.text += $event.message

 $label11.text += $event.ReplacementStrings

 #Get the Event Logs over the duration of time request, sort, group and create Excel Chart

 $events = Get-EventLog -LogName $logfile.text -instanceid $id -After ((Get-Date).Date.AddDays(-$num))| Group-Object {$_.TimeWritten.Date}

 foreach ($stat in $events){

 $Time = $stat.name

 $Count = $stat.Count

 $ti = Get-Date($Time)

 $day = $ti.day

 $month = $ti.month

 $year = $ti.year

 $sh.Cells.Item(1,$q) = "$day/$month/$year"

 $sh.Cells.Item(2,$q) = $count

 $q = $q +1

 }

 $range=$sh.UsedRange

 $range.activate


 $ch = $xl.charts.add()

 $ch.chartstyle = 47

 $ch.haslegend = $false

 $ch.hastitle = $true

 $ch.setSourceData($range)

 $ch.ChartTitle.Caption = "EventLog $ev for Period of $num days"

 $ch.HasDataTable = $true

 $t = $ch.SeriesCollection("Series1")

 $t.name = "Count"

 #Turn the Excel chart into a JPG and load it intoour Chart Viewer

 $fname = "Results"+$instanceid.text+".jpg"

 $ch.export("$home\Documents\results$ev.jpg")

 $results = (Get-Item "$home\Documents\results$ev.jpg")

 $chart.image = [System.Drawing.Image]::Fromfile($results)

 }
And we are done. We now have our very own functional Event Statistic program.
Conclusion
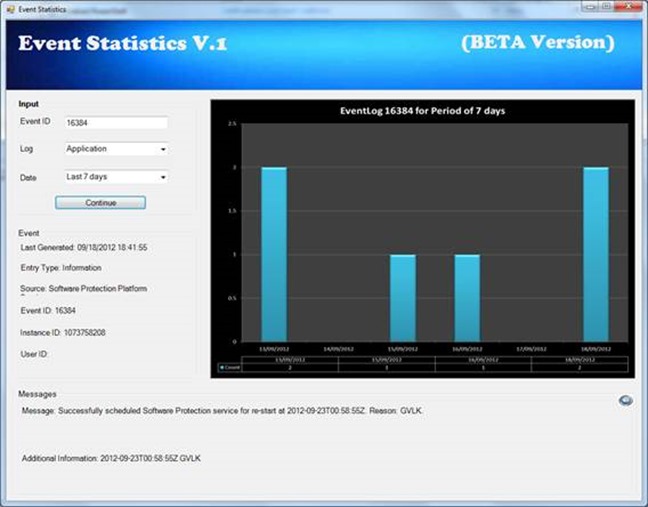
As with everything we are never fully complete until we run the program and make sure it works. This is what it looks like after doing a 1 week check on Event 16384.
This tool has been a saving grace for me. Many times we see an event that looks like it may be the cause of an issue but without the history of the event it makes it harder to narrow down.
Example: I was onsite with a customer that was getting what looked like random 503 Service Unavailable issues in their event logs. Using this tool I was able to see when and how frequently this occurred. When we ran this program we saw that it was not random but was happening on specific days. Turns out it was the SQL team’s maintenance window, so there was no need to worry about seeing that error as was after all a valid reason for it.
Hope you enjoyed this article and please feel free to ask question or make suggestions. If you’re interested, you can also get the source code included in this article right here.

