How to Set Up the Performance Analyzer for Microsoft Dynamics AX
Written by Rob Hansen, Microsoft Premier Field Engineer.
 Performance Analyzer 1.0 for Microsoft Dynamics is the tool used by Microsoft Dynamics support teams, Premier Field Engineers, and product team members to diagnose performance issues with Dynamics products. The following is a step-by-step guide to installing this toolset on your SQL Server environment.
This tool is delivered as a SQL Server solution file and can be downloaded from https://code.msdn.com/dynamicsperf. Once the file is unzipped the solution can be opened from within SQL Server Management Studio.
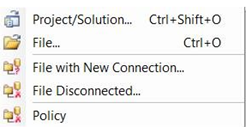
On the Menu, click File | Open | Project Solution
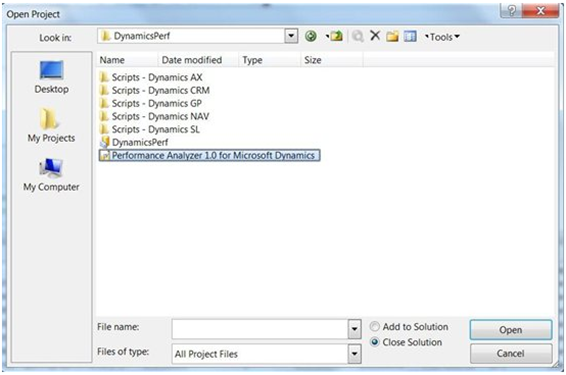
Choose the Performance Analyzer 1.0 for Microsoft Dynamics Solution file
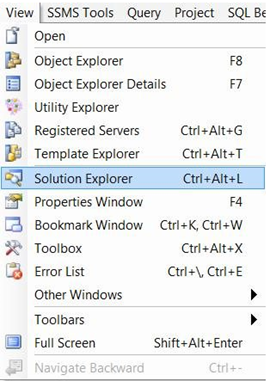
To view the Solution Explorer in SQL Server Management Studio, click View | Solution Explorer or Ctrl - ALT-L.
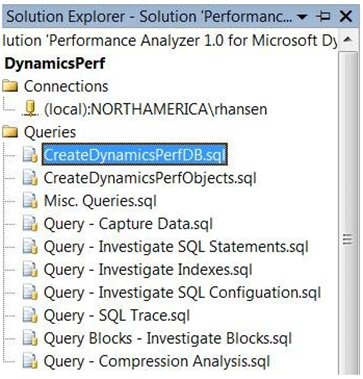
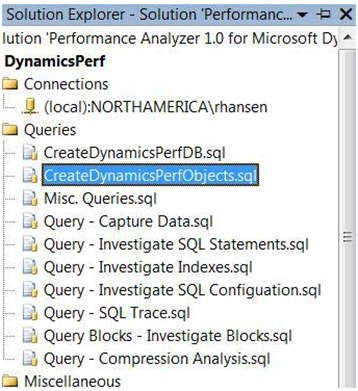
The next step in deploying the tool is creating the database and the objects. In Solution Explorer, on the right hand side, select CreateDynamicsPerfDB.sql query.
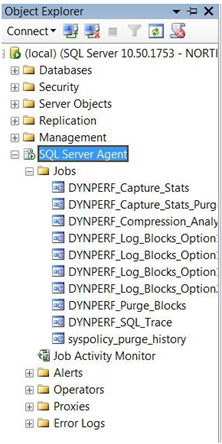
This script will create a database called DynamicsPerf in the default location. It is initially 500Mb for the data file and 100Mb for the Transaction Log file for this database. Each data collection is approximately 500Mb to 1 GB in size. This varies widely depending upon total system memory and how much activity is occurring. To manage database size there is a job called DYNPERF_Capture_Stats_Purge. This job by default will run once per day at 6PM and delete data older then 7 days old. Adjusting the number of days to retain data in this job is the method for controlling the database size of the DynamicsPerf database.
The next step is to create all of the database objects and SQL Jobs used by Performance Analyzer. Select CreateDynamicsPerfObjects.sql query on the right hand side in Solution Explorer.
This script creates all of the Tables, Procedures, and SQL Jobs used by the tool in the DynamicsPerf database. In order to do blocking analysis, the script will set a configuration option called "Blocked Processes Report" to five seconds. (Setting up data gathering for blocking will be explained in another blog post.) After running the create object script the results returned from this script should look as follows:
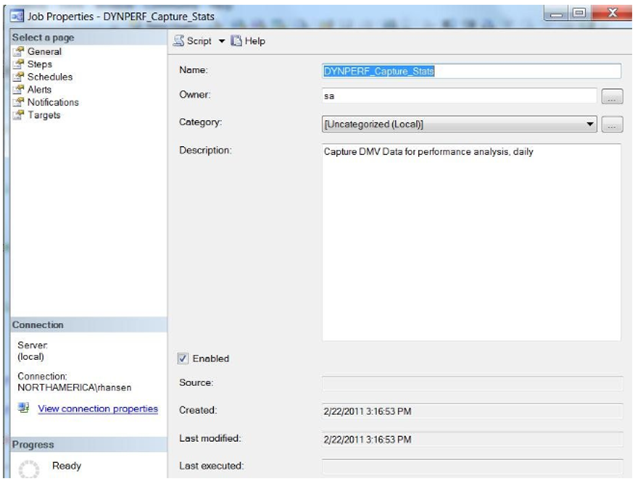
Performance Analyzer is designed to capture all Query and Index data for one database. To make this easier to configure, all basic functionality to collect data has been provided in a set of SQL Jobs. In order to do basic data capture, the SQL Job called DYNPERF_Capture_Stats must be edited to define which database to collect performance data on.
Either double click this job, or right click and select properties. This should bring up the following dialog to edit the SQL job.
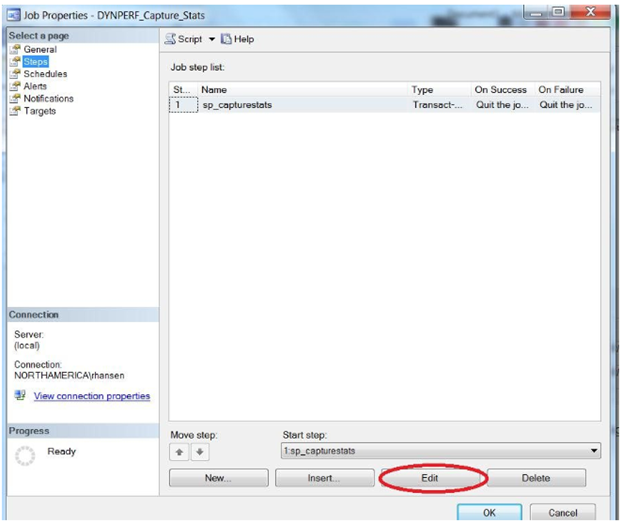
Click on the Steps page on the left hand side of this dialog
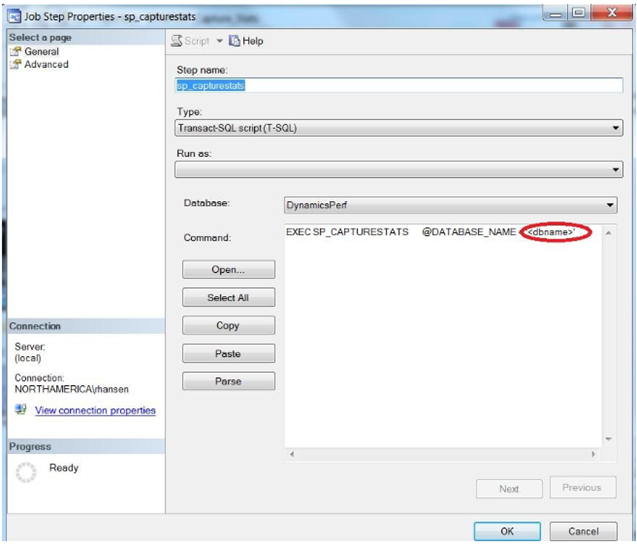
Click the Edit button to edit the single step in this job.
In the command of this job step, change the '<dbname>' to the name of the database to collect performance data from such as 'AX_Live'. Click the 'Ok' button to save the changes.
At this point, basic data collection has been setup for Performance Analyzer . By default data will be collected once per day at 5PM. This is the default schedule for the DYNPERF_Capture_Stats job, but you can edit it to find a time that better fits the data you're trying to collect.
If you have any questions or issues, please leave a note in the comments or email us at pfedynamics@microsoft.com. If you're interested in having a Performance Review done on your system using the Performance Analyzer tool, you can find more information here.
Editor’s Note: if you want to check out more great Dynamics AX content by Microsoft Premier Field Engineers, make sure you visit Dynamics AX in the Field.
