How To Build A Simple and Efficient Windows Monitoring Solution (DTW)
Written by Samuel Drey, Microsoft Premier Field Engineer.
In this article, I’ll provide a quick reference guide and an Excel-based tool that allows you to build monitoring consoles using HTML without being a scripting star. I call it the Document-Tool-Walkthrough (DTW).
This is a new concept document/tool built using Excel that can help you to build System Monitor consoles that are centrally stored to monitor your servers. You can build as many consoles as you want using this tool, with each console being responsible for monitoring a specific area of your IT infrastructure (e.g. one for Exchange databases, another for disk latencies, another for core resources of DC servers, etc.), You can store these in a central place where administrators will be able to open them and monitor (or troubleshoot) their servers. People using this tool won’t need any knowledge about scripting (or at least very little) as the code is generated automatically through the Excel tabs.
Please note this tool is provided as is, but feedback and input is appreciated.
Download a zip archive of the document and tools from here: DTW Tools and Documents
DTW Overview
The DTW concept stands for a document that can be integrated into a tool and contains step-by-step instructions on how to do things.
- In this DTW, you will find code generator parts based solely on Excel formulas (no macros), and guidance that will help you understand and build helpful, portable System Monitor consoles via HTA (HTml Application) files (or HTM files if you’re not concerned about browser security warnings).
- These HTA Sysmon consoles will be very helpful in monitoring important real-time specific items in an IT infrastructure such as latencies, server loads, user connections statuses on messaging, file or database servers, and a lot more. Best about it, these can be stored on network shares, so that every administrator can launch these from a central location!
- Finally, with more HTML development knowledge, this DTW will also help to build entire monitoring-based websites that will be a good complement to Microsoft OpsMgr in the way that at any time you will be able to call your DTW-based system monitor HTA consoles to check for vital information on your IT components.
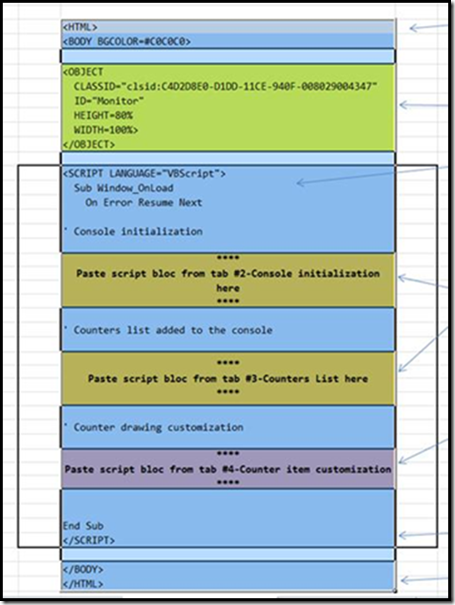
Step 1: Go to the "1- Perfmon HTML Header" tab in the Excel DTW Tool
Select and copy the code between the <HTML> and the </HTML> tag
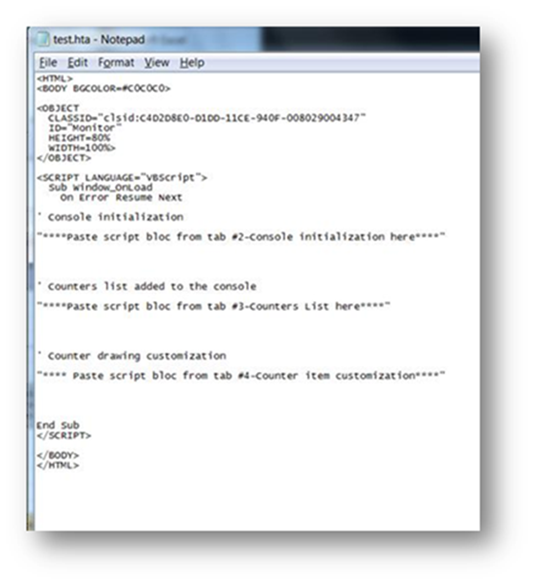
Step 2: Paste this code in a blank Notepad file as-is
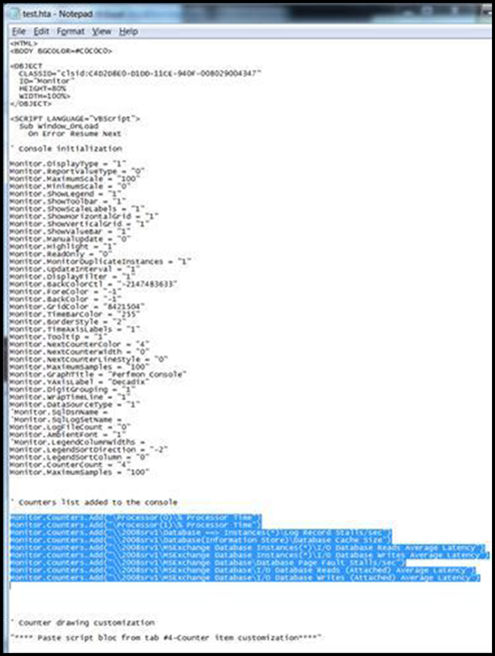
Copy lines between the HTML tags then paste them on a blank notepad file that's leads to the following screenshot :
Step 3: Update the "2-Console initialization" tab in the Excel DTW Tool
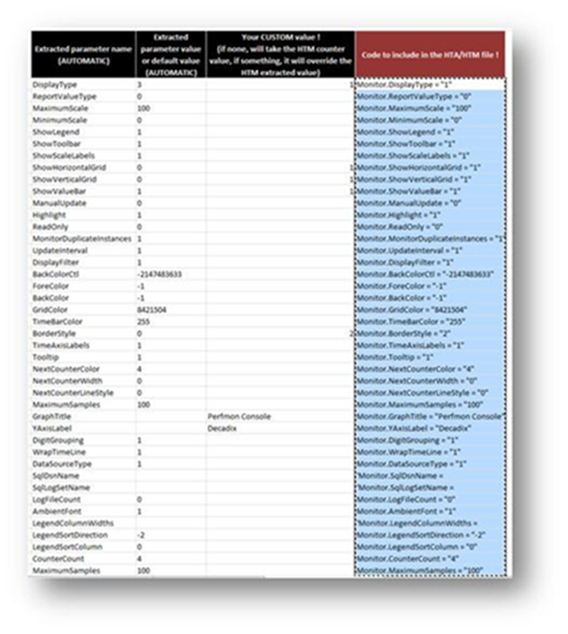
If you wish to customize the look of your Sysmon console, for example display as a graph (DisplayType =1), as an histogram (DisplayType=2) or just as data (DisplayType=3), put the appropriate value in the "Your CUSTOM value" column.
Default values correspond to a report-like real-time view, with an update interval of 1 second (UpdateInterval=1), not read-only (ReadOnly=1 - meaning you can interact with the graphical console), Legend printed for each counter (ShowLegend=1), etc.
The description of all other properties of your Sysmon console are described in the following links :
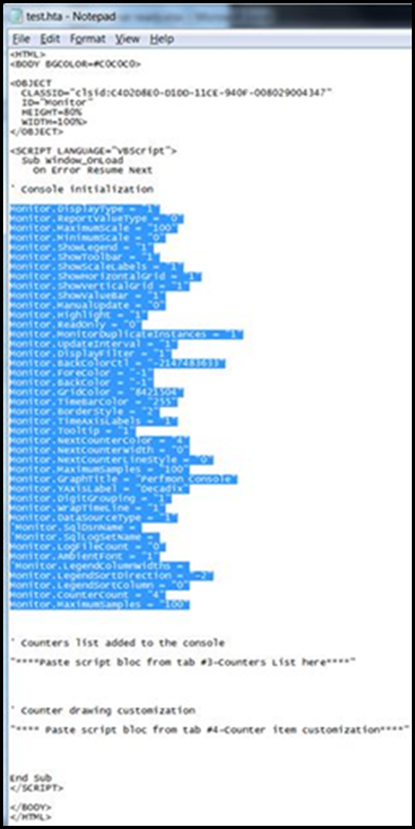
Copy the items in the 4th column (red header) on the "console initialization" section:
Step 4: Update the "3-Counters List" tab in the Excel DTW Tool
4.1. Search and print a set of counter paths with PowerShell
The following PowerShell commands show how to get the counter paths for a particular set of counters.
- Take a counter category of your choice (-listset "CounterCategoryName" or if you don’t know the exact name, use wildcards, for example to pick database related counter categories, use the following syntax: -listset “*database*”)
- Then list the available counter paths with all instances (pipe then Select instructing PowerShell to expand the "PathsWithInstances" property to print everything), and finally, pipe again to filter against a specific subset of counterpaths, for example if you are looking for monitoring client connections in the following examples:
Example 1:
=> The "PathWithInstances" property of a counter object allows Powershell to print counters for each instances (for example in Exchange, the "Database" counter category, for the "Database read latency" counter, there is one of these counters for each database: each database represents an instance
Example 2:
=> The "Counter" property of a counter object allows PowerShell to print counters for all instances (not each instance separately - it is if you wish to monitor counters for all instances - if you're not interested in monitoring each instance - example monitor overall processor activity instead of each processor core activity)
=> This example is to display all counters counting all client connection TYPES (Admin connections, Web Services, RPC Service, OWA, etc…) - the PathsWithInstances will detail all these connection TYPES, whereas the Counter property would monitor the global connection count
Example 3:
=> this last example is to get the counters of the database category, and showing information about latency to start diagnosing a potential database latency issues. From that, you will set up HTA consoles with other counters such as memory counters, disk counters, etc... I’ll provide you with all the important Exchange counters to monitor in another article, in a way that you’ll be able to easily use these with this tool.
4.2 Fill the Col 2 -"Server to monitor" and Col 3 "Counter path" columns
Copy the counter path on the "Counter path to add" column, the "code to include" will automatically generate itself! You can specify a server to monitor, if no servers are specified, the local machine on wich the htm or hta file will be run will be monitored.
4.3 Put an optional number in the Col 1 -"Counter Item Nb" column if you plan to customize the look of the counter graphs on the next tab
Copy the items in the 4th column (red header) on the "Counters list" part
Step 5 (Optional): Edit the “4-Counter Customization” tab in the Excel DTW Tool
- Identify the counter item number you wish to customize from the previous tab (“3-Counters List”) – i.e. by order of added counter in your VBS code
- To modify the counter identified in Step 1, put the corresponding item number in the first column Col 1 – “Item number” below (e.g. item 1 : first counter in your list, etc…)
- Then change the value for the desired property for this counter (Color, Width, etc….) if you wish, in column Col 5 – “Your custom value”
- If you put no values and if there is no “Default value” defined on Col 4 – “Default value”, the line will be tagged as a comment and will be bypassed by the VBS scripting engine
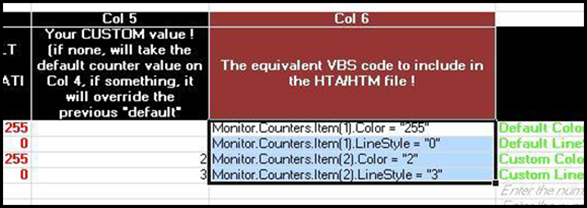
Zooming on the column to paste on your code shows:
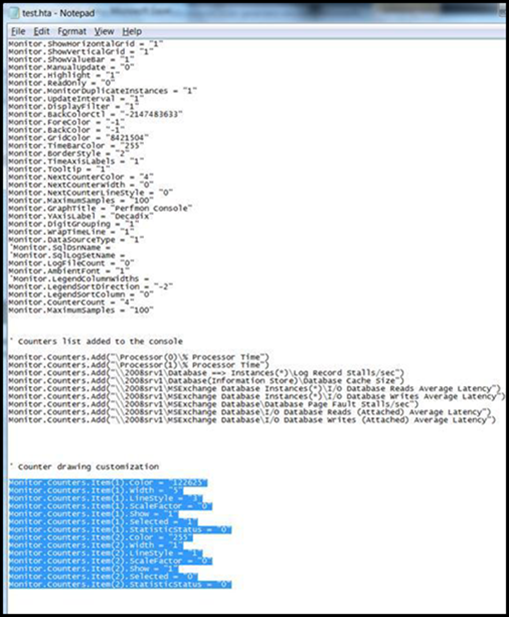
Copy the items in the 6th column (red header) on the "Counter item customization" section
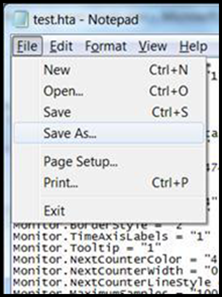
Step 6 [REQUIRED]: You're all set, save your console file to an HTA file and run it!
Save your newly created console HTA file!
The resulting icon shortcut ...
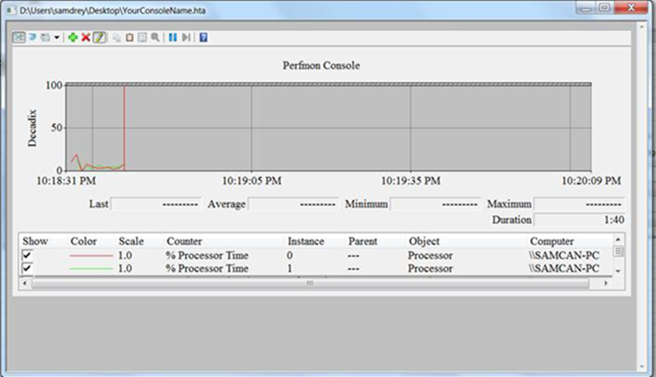
The result: a real-time HTA console that you can run from a USB key or a network share from any workstation or server :
- For further developments, you can have an HTA console with 3, 4 or more real-time System Monitors inside, or create a web page with links to other web pages to consoles depending on which part of Exchange, SQL, Windows, etc. you wish to monitor in real time. The possibilities are huge with this perfmon scripting tip!
- If you wish to add multiple System Monitor windows in a single HTA or HTM page, you will just have to define multiple Sysmon instances by creating multiple HTA files first with this Excel walkthru, then merge all your code into one file, but do not forget to give a different ID to all the Sysmon consoles you create separately by using the information in Step 5! Anyway, we enter now pure HTML development, but that's another story...
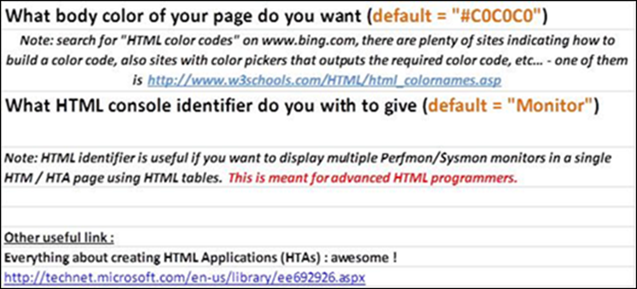
Step 7 [Optional]: Define below the body color of the HTA page, and the Perfmon console "code identifier"
These are options you can configure inside the XML document-tool to change general HTML behaviour of your final HTA console, and also, for advanced HTML programmers, you can define the identifier of the console you are building with the tool.
