Creating Custom Performance Reports in System Center Operations Manager 2007
Written by Neil Harrison, Microsoft Premier Field Engineer
 Recently, I was working with a customer and one of the questions they asked was how to create a new report in Microsoft System Center Operations Manager 2007 (OpsMgr 2007) based on a combination of different performance counters. It seems they had specific requirements given to them by one of their server administrators about what performance counters they wanted to see in a single report.
This is actually a very simple thing to do and can be done by using one of the Performance reports contained in the Generic Report Library.
For example, let’s assume we need to create a report with two separate charts. The first chart needs to contain the ‘Processor - % Processor Time’ counter. The second chart will hold the counter ‘LogicalDisk – Avg. Disk Queue Length’ .
Here are the steps to create such a report:
- Determine whether the performance counter data you wish to report on already exists within the OpsMgr Data Warehouse. If the performance data does not exist then you will need to create a rule to collect that performance data. You can find instructions on TechNet for creating this type of rule.
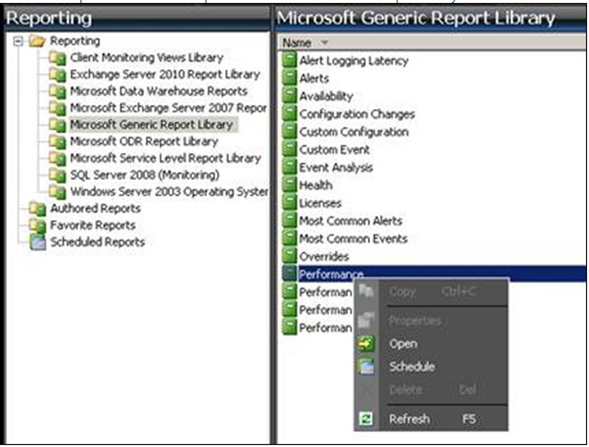
- In this example, we know that we have previously imported the Windows Server Core OS Management Packs so these performance collection rules are enabled by default. We can now move on to building the report. The first thing we’ll need to do is open the Performance report under the Microsoft Generic Report Library folder.
- Click the Change button to launch a dialog box that will allow us to choose charts and series to add to this report.
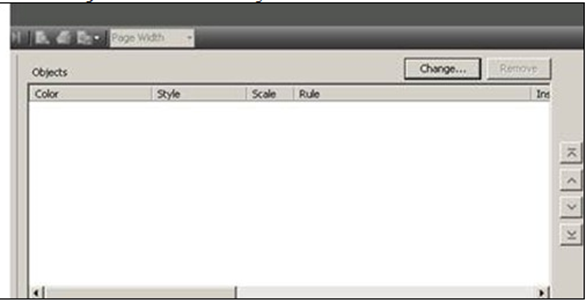
- Select New Chart and give the chart a meaningful name such as “My Server – Processor”.
- Select New Series and choose a color and style for the series.
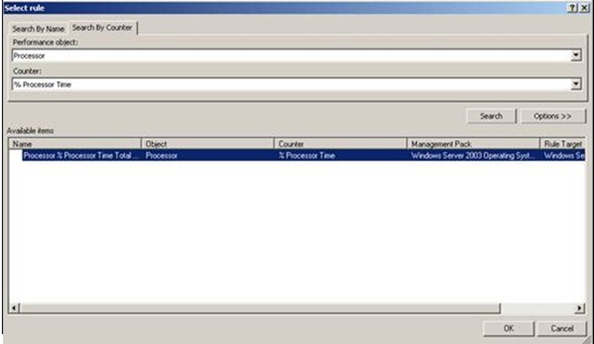
- Now we can attach an actual performance counter to the series by selecting Browse in the Rule section of the dialog box. A rule search window will launch with two tabs. I prefer to use the Search By Counter tab.
- Select ‘Processor’ in the Performance Object drop-down list and choose ‘% Processor Time’ in the Counter drop-down list. Click Search. The matching performance counters should appear in the search results box. Choose the one that matches the server you are reporting against and select OK.
- Now we need to select the server that we want to report against with that performance counter. Select the Add Object button to launch the object picker. In the Object Picker we need to make sure that we can see all of our ‘Windows Server Operating System’ objects as this class will be what the event collection rule is targeted against. Select Options and add the Windows Server Operating System class as a filter option.
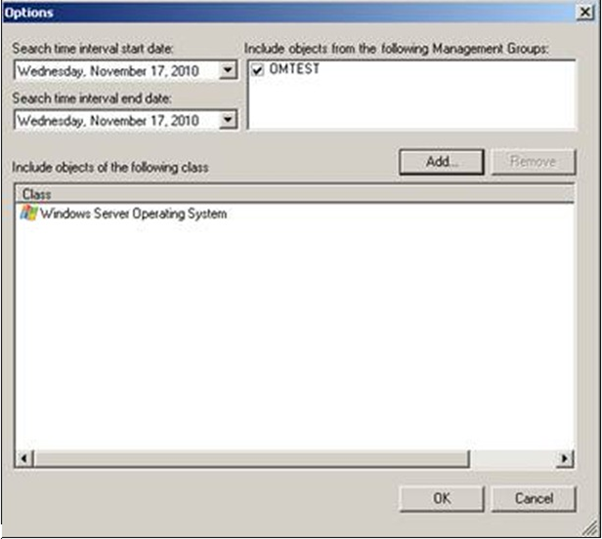
- Select Search to show all of the ‘Windows Server Operating System’ objects that exist in the OpsMgr database. Choose the one that corresponds to the server we are going to report against.
- At this point we have successfully added one of the charts that we need for the finished report. We’ll now need to perform steps 4 through 9 again and but this time we’ll add the counter ‘Logical Disk – Avg. Disk Queue Length’ .
Note: Remember that the collection rule for this counter is targeted at the class Logical Disk as opposed to the Windows Server Operating System. This means that in step 8 we’ll need to filter by objects of type Logical Disk.
11. Your final results should look similar to the following: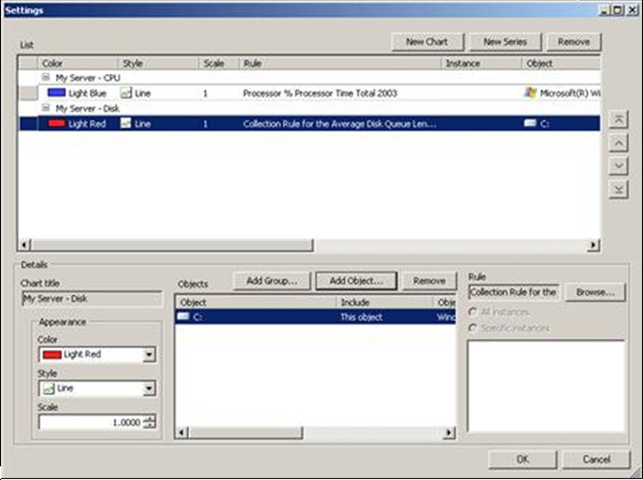
12. The only thing left to do at this point is to configure the time range and subsequently run the report. Once we run the report we can choose to save the final result to our Favorites folder or to a custom MP.
That’s it! Armed with this knowledge you should now be able to create any reports you need based on Windows performance counters in System Center Operations Manager 2007.