Azure Log Analytics Container Monitoring solution for Linux Service Fabric
Hello all, this is Keiko, Program Manager from the Log Analytics team. We are excited to extend our monitoring capabilities to Service Fabric containers running on Linux servers.
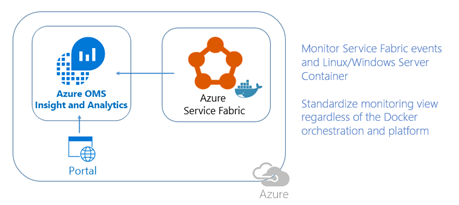
Service Fabric on Linux as a container orchestrator is now generally available. For more details about container deployment and orchestration on Service Fabric, please see this announcement. For more information about Service Fabric in general, head over to the Azure Service Fabric overview.
With the Azure Log Analytics Container Monitoring solution on Service Fabric Linux clusters, you can now:
- Centralize and correlate millions of logs from containers at scale in the cloud.
- See real-time metrics on CPU, memory, storage, network usage, and performance for containers and nodes.
- Identify containers that consume excess resources on a host.
- Monitor resource usage on a per-process level (Docker container top).
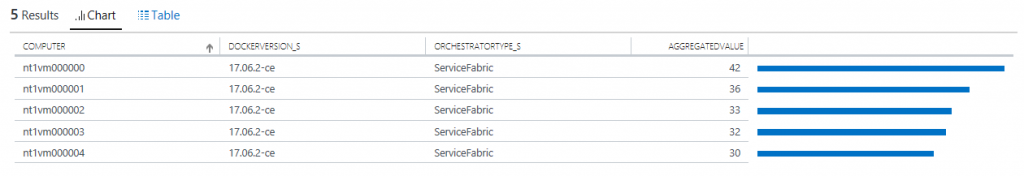
- View overall container node inventory, which includes orchestration information.
Azure Resource Manager template for seamless installation with Service Fabric
Service Fabric has created an Azure Resource Manager template, which installs the Azure Log Analytics OMS agents on all nodes of a new Service Fabric cluster. The template also generates a Log Analytics workspace alongside the cluster deployment. This makes it easier for you to deploy multiple resources together, or have the flexibility to scale resources as your needs change. The agent is included as a VM extension—it is deployed automatically on each new machine and hooked up to the right workplace.
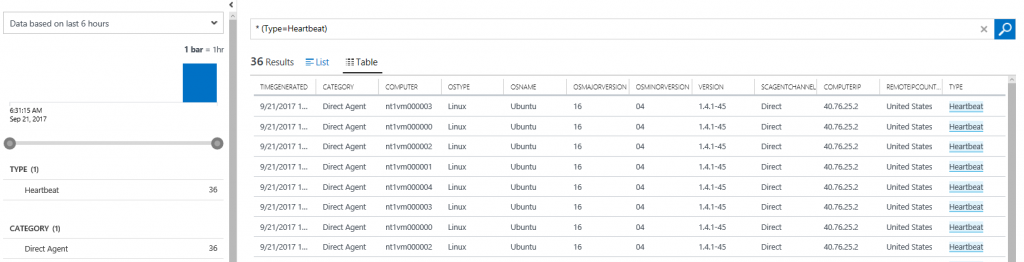
After the cluster is deployed, you can add the Container Monitoring solution (via the Azure Marketplace) to that Log Analytics workspace. The workspace starts to populate automatically in a few minutes. With this Azure Resource Manager template, you can set this up in a single motion, rather than installing multiple components and configuring them separately. As the following screenshot shows, when the template is deployed, Log Analytics shows the events.
To use this template to set up monitoring and diagnostics through Log Analytics for your Service Fabric orchestrated containers, go here.
How do I try this?
Join Microsoft Azure today for free to start testing the Container Monitoring solution features.
How can I give you guys feedback?
There are a few different routes to give feedback:
- UserVoice: Post ideas for new Azure Log Analytics features to work on. Visit the UserVoice page.
- Forums: Visit the Azure Log Analytics Forums.
- Email: Tell us whatever is on your mind by emailing us at OMScontainers@microsoft.com.
We plan on enhancing monitoring capabilities for containers. If you have feedback or questions, please feel free to contact us!
Keiko Harada
Senior Program Manager, OMS team