Build an infrastructure monitoring solution with Service Map
Have you ever been responsible for a flaky application, and wanted to set up an automatic notification when a server, process, or connection isn't there when it should be? Me too! And by using OMS Azure Log Analytics and Service Map, I solved my problem with the built-in features and a small bit of PowerShell.
To help show off the usefulness of Service Map, we built a simple, three-tier, hybrid cloud application. It has Internet Information Services (IIS) in an Azure VM Scale Set in the front end, a Tomcat server running on Linux in the middle, and MySQL for a back end. We use two additional servers running JMeter to generate constant load to the app. And, to make things a bit more interesting, we have a piece of code that runs periodically on the Tomcat server that affects performance by consuming high CPU and memory.
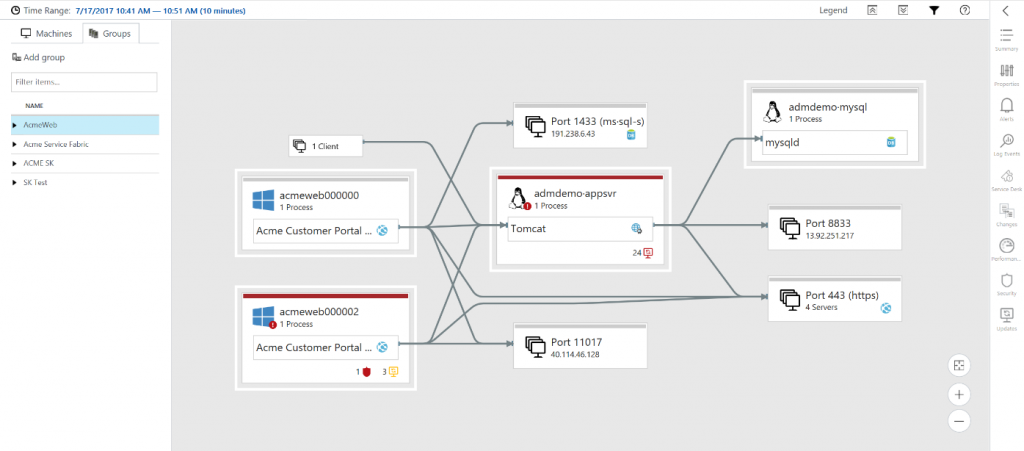
All in all, it's a pretty simple application—I'm sure your real-world apps are much more complicated—but because we intentionally try to make it run poorly, it sometimes breaks. Maybe a server was restarted and JMeter didn't get relaunched. Or maybe we used a bit too much memory on our application server, and the Tomcat server died. Nothing's more frustrating than getting ready to run a demo and noticing that your app is no longer there.
Fortunately, the very tools we're trying to demonstrate are very useful for monitoring themselves. That's the whole point, isn't it?
So, I wrote a script. Service Map has a REST API that allows you to query for any information that Service Map has. If you see it on the Service Map UI, you can get it via the API.
My script uses the very handy armclient and a service principal to handle authentication and building the Azure Resource Manager API calls.
# Service Principal values - see https://blog.davidebbo.com/2014/12/azure-service-principal.html for explanation $TenantId = "<your Tenant ID here>" $AppId = "<Your application ID here>" $Password = "<Your SPN password here>" armclient spn $TenantId $AppId $Password
Because the box that runs the Tomcat server is both the most important and the most fragile machine in my application, the script focuses on that machine. (For the same reason, I have this script run on a different server, NOT the one I'm looking to monitor). First, we query the list of machines that are available in the most recent five minutes, and see if the app server is in that list. If the server isn't there, we log that, and go to sleep for five minutes before checking again.
$apicall = "$myAPIPath/features/serviceMap/machines?api-version=2015-11-01-preview&startTime=$startTime&endTime=$endTime"
$machines = armclient get $apicall | ConvertFrom-Json
foreach($machine in $machines.value) {
if ($machine.properties.displayName -like $targetMachine) {
$foundMachine = $true
}
}
if (!$foundMachine) {
Write-Log -Message ("Can't find machine " + $targetMachine) -Severity 3
}
If our app server is there, we then go on to get all of the processes running on the box. Is Tomcat server there? No? Log that and go to sleep.
# Call to get the processes for this machine
$apicall = "$myAPIPath/features/serviceMap/machines/" + $machine.name + "/processes?api-version=2015-11-01-preview&startTime=" + $startTime + "&endTime=" + $endTime
$processes = armclient get $apicall | ConvertFrom-Json
foreach ($process in $processes.value) {
if ($process.properties.displayName -like $targetProcess) {
$foundProcess = $true
break
}
}
if (!$foundProcess) {
Write-Log -Message ("Can't find " + $targetProcess + " on machine " + $targetMachine) -Severity 3
}
If Tomcat server is happily running, the last check is for connections from Tomcat server out to our MySQL box. If the connections aren't there, we log that.
# Call to get everything in a map
$mapRequest = "{ 'startTime':'$startTime', 'endTime':'$endTime', 'kind':'map:single-machine-dependency', 'machineId':'" + $machine.id + "' }"
$apicall = "$myAPIPath/features/serviceMap/generateMap?api-version=2015-11-01-preview"
$serverdep = armclient post $apicall $mapRequest | ConvertFrom-Json
foreach ($connection in $serverdep.map.edges.connections) {
$clientProcess = FindProcess $serverDep.map.nodes.processes $connection.properties.source.id
$serverPort = FindPort $serverDep.map.nodes.ports $connection.properties.serverPort.id
if (($clientProcess.properties.displayName -like $targetProcess) -and ($serverPort.properties.portNumber -eq $targetPort)){
$foundProcessOutgoingEdges = $true
break
}
}
if (!$foundProcessOutgoingEdges) {
Write-Log -Message ("Can't find connections to port " + $targetPort + " from " + $targetProcess + " on machine " + $targetMachine) -Severity 3
}
If those connections are there, that means everything is running perfectly, and we write a positive status message to the log file.
else {
Write-Log -Message "Demo application is healthy"
}
Every five minutes, the script wakes up and checks it all again.
Start-Sleep -s $period
So, that gets us a nice log file containing the status of our application at five-minute intervals. It should look something like this:
"DateTime","Severity","Message" "6/2/2017 11:00:22 AM","3","Can't find Tomcat on machine admdemo-appsvr" "6/2/2017 11:07:22 AM","3","Can't find Tomcat on machine admdemo-appsvr" "6/2/2017 11:11:32 AM","3","Can't find connections from Tomcat on machine admdemo-appsvr" "6/2/2017 11:14:05 AM","3","Can't find connections from Tomcat on machine admdemo-appsvr" "6/2/2017 11:14:42 AM","3","Can't find connections from Tomcat on machine admdemo-appsvr" "6/2/2017 11:18:13 AM","1","Demo application is healthy" "6/2/2017 11:24:48 AM","1","Demo application is healthy" "6/2/2017 11:29:57 AM","1","Demo application is healthy" "6/2/2017 11:35:05 AM","1","Demo application is healthy"
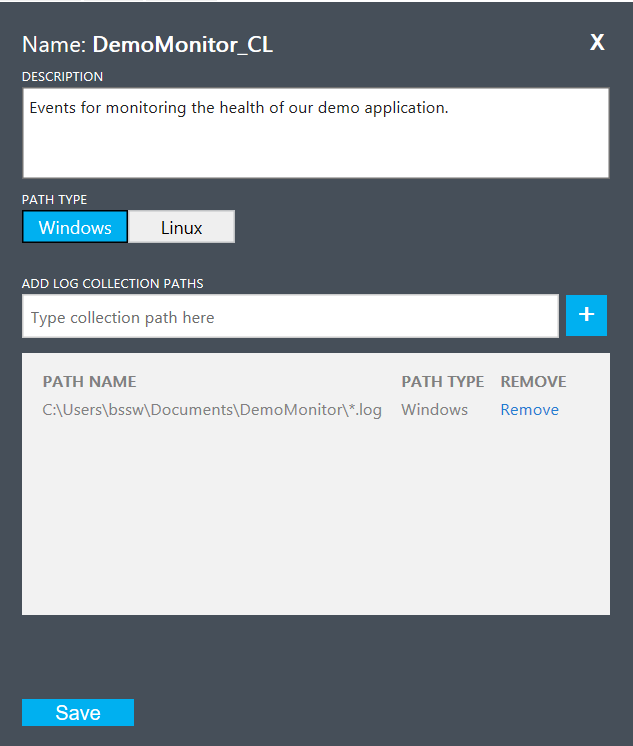
The next step is to get that log file into Log Analytics. That's easily done by configuring a custom log in Log Analytics.
After a few minutes, the individual records start flowing into Log Analytics.
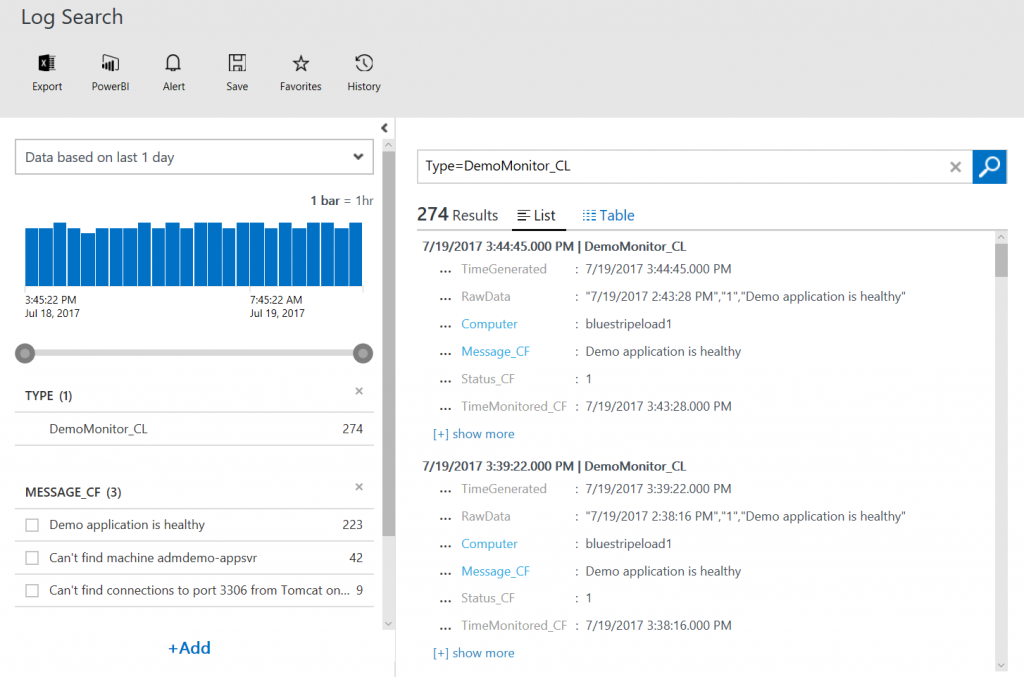
After that, I taught Log Analytics how to pull out custom fields, in particular Status_CF, because that's what I want to focus on for my alerts.
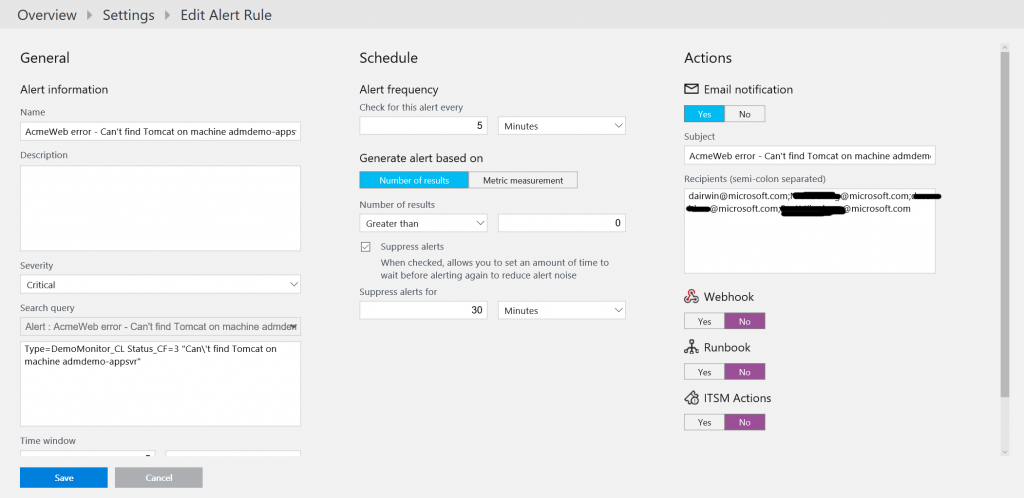
Finally, I set up four alerts. Three were to look for the various error conditions—missing machine, missing process, missing connections—and a fourth to let me know if the monitoring itself has stopped.
And voila! Now I have a custom monitoring framework for our demo application. This has made my life much easier, and demos more predictable.
A few ideas for how to improve this script in a future version:
- Run the script in an Azure Automation account, so I don't need a separate server to run it.
- Ingest the data into Log Analytics by using the API instead of a custom log.
- Set up a custom view to display the status of the app.
I should also mention that we've taken some of these concepts—for example, alerting on structure changes or failed connections—and put them in our feature backlog. We want to surface these features directly in the Service Map UI so it's even easier for users to monitor their systems and applications.
Want to try this for yourself? You can find my full script (with a bit more complexity than I showed in the examples above) in the PowerShell Gallery. Let me know how you like it!
David Irwin, Senior Program Manager