Azure SQL Analytics solution – Public Preview
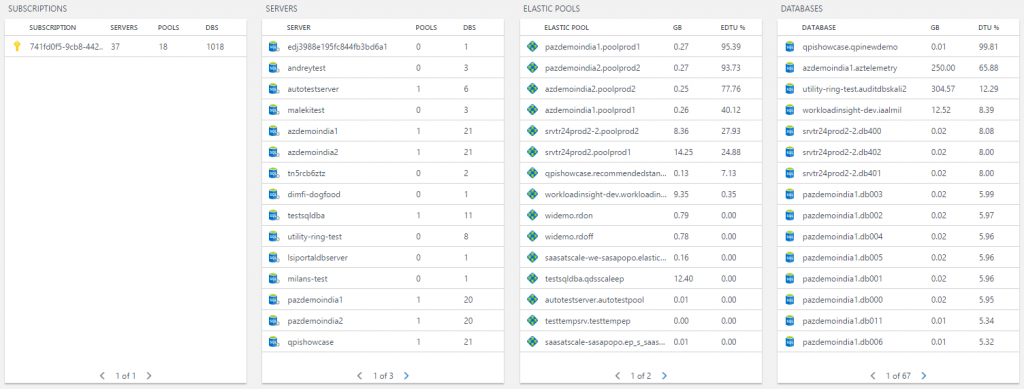
Microsoft Azure SQL Database is a scalable relational database service that provides capabilities that are familiar to SQL Server to applications that run in Azure. Azure SQL Analytics, which part of OMS Insight and Analytics, collects and visualizes the important SQL Azure performance metrics that enable users to easily create custom monitoring rules and alert on these rules under defined scenarios. The solution, now in public preview, enables you to monitor across multiple Azure subscriptions, resources and elastic pools. More importantly, you can identify issues at each layer of your application stack.

By using the Azure SQL Analytics solution, you can capture metrics (across subscriptions and elastic pools) from Azure SQL Database and elastic pools and visualize them in Operations Management Suite (Log Analytics). This solution takes advantage of Azure Diagnostic metrics and Log Analytics views to present data about all your instances of Azure SQL Database and elastic pools in a single log analytics workspace.
Prerequisites
- Azure subscription. If you don't have one, you can get a free Azure account.
- Operations Management Suite Log Analytics Workspace. Use an existing workspace or create a new workspace upon deployment.
- Enable Azure Diagnostics for Azure SQL Database and elastic pools and configure them to send their data to Log Analytics.
How do I get started?
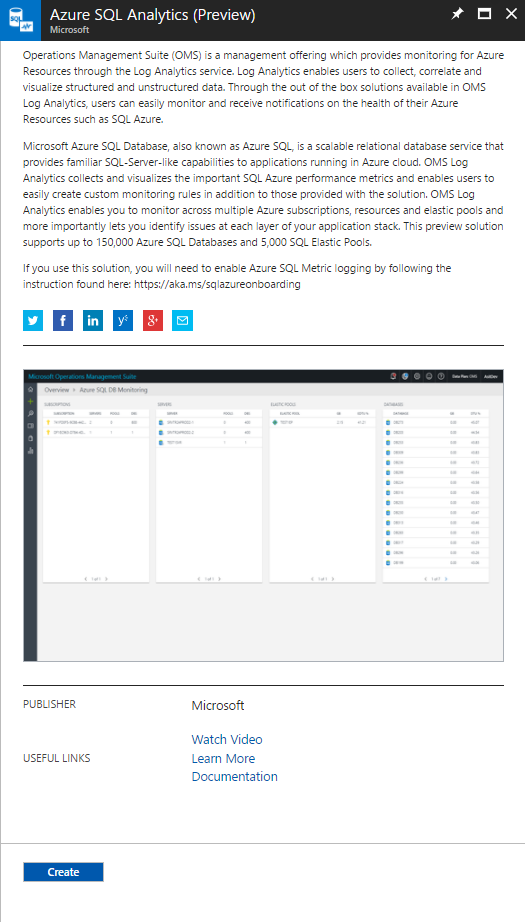
- In the Azure portal, click the Marketplace tile, click Monitoring + Management, and search for Azure SQL Analytics, and then click Azure SQL Analytics in the search results.
- Click the Create button to start the configuration wizard in the Azure portal and configure the solution.

- Follow the steps in the UI to start the installation and configuration of this solution.
Support for more than one Azure subscription (Advanced scenario)
To support multiple subscriptions, use the PowerShell script in the Enable Azure resource metrics logging using PowerShell blog post. Simply provide the workspace resource ID as a parameter when you execute the script to send diagnostic data from resources in one Azure subscription to an OMS workspace in another Azure subscription.
Example
PS C:\> $WSID = "/subscriptions/<subID>/resourcegroups/oms/providers/microsoft.operationalinsights/workspaces/omsws"
PS C:\> .\Enable-AzureRMDiagnostics.ps1 -WSID $WSID
Analyze data and create alerts
Using the data coming from Azure SQL Database resources you can easily create alerts. Here are few useful queries that you can use for alerting:
High DTU on Azure SQL Database
Type=AzureMetrics ResourceProvider="MICROSOFT.SQL" ResourceId=*"/DATABASES/"* MetricName=dtu_consumption_percent | measure Avg(Average) by Resource interval 5minutes
High DTU on Azure SQL Database Elastic Pool
Type=AzureMetrics ResourceProvider="MICROSOFT.SQL" ResourceId=*"/ELASTICPOOLS/"* MetricName=dtu_consumption_percent | measure avg(Average) by Resource interval 5minutes
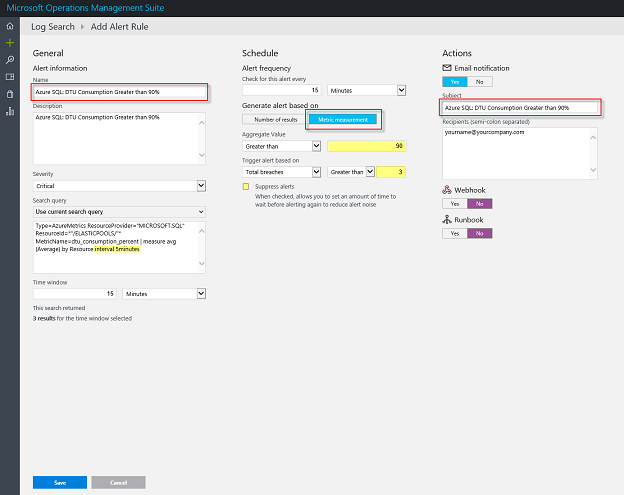
These alert-based queries can be used to alert on specific thresholds for both Azure SQL Database and elastic pools. To configure an alert for your OMS workspace:
- Go to https://mms.microsoft.com.
- Authenticate to the OMS workspace that you have configured for this solution.
- Click on Log Search
- Select alert from the list of options

- Configure the appropriate properties and the specific thresholds

One of the most useful queries that you can perform is to compare the DTU utilization across all Azure SQL Elastic Pools across all your subscriptions. Database Throughput Unit (DTU) provides a way to describe the relative capacity of a performance level of Basic, Standard, and Premium databases and pools. DTUs are based on a blended measure of CPU, memory, reads, and writes. As DTUs increase, the power offered by the performance level increases. For example, a performance level with 5 DTUs has five times more power than a performance level with 1 DTU. A maximum DTU quota applies to each server and elastic pool.
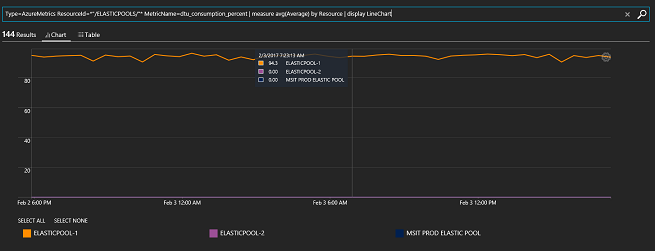
By running the following query, you can easily tell if you are underutilizing or over utilizing your SQL Azure elastic pools.
Type=AzureMetrics ResourceId=*"/ELASTICPOOLS/"* MetricName=dtu_consumption_percent | measure avg(Average) by Resource | display LineChart
In the following example, we can clearly see one elastic pool has a heavy spike near 100% DTU. We can then use this information to troubleshoot potential recent changes in our environment by using Azure Activity logs.

Thank you!
We hope you find this solution useful to help you to gain more insights into your Azure SQL environments. Your feedback helps drive innovation in our solutions.
Jim Britt
Senior Program Manager