Visualizing weather information in Microsoft OMS
Summary: Gather data from a URI and send it to OMS through the HTTP API.
In case you missed it, Martin Ehrnst put together a great example of how you can gather data from a URI and send it to OMS through the HTTP API. His example shows this for two different sources of weather and it is available at: https://adatum.no/powershell/weather-data-in-oms-log-analytics.
Now that you have this type of data in OMS, what can you do with it? This blog post will show how you can utilize the data gathered by OMS in queries and dashboards and how you to create your own solution in OMS!
Queries for data uploaded through the HTTP API
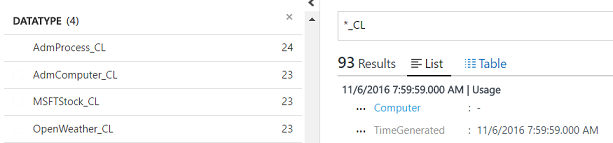
The quickest way that I have found to track down new data that’s being added is to use a “ *_CL” query. It gets a list of types of data that are being collected by the workspace that were added by the HTTP API. All data that's sent up via the API automatically adds _CL to the end of the DataType.
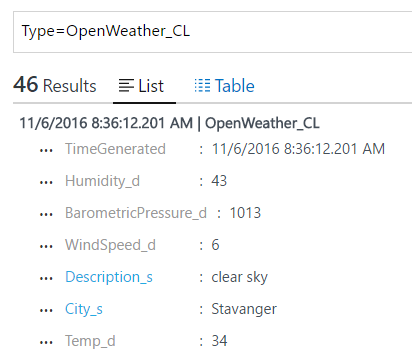
From this query, we can reduce it to the particular data we are looking for (OpenWeather data in this example). Query: Type=OpenWeather_CL,
From here, we can see a list of the data. It’s interesting to note how the API handles different types of data. The API automatically adds a _s to each string and an _d to each integer. Note how Humidity is Humidity_d, WindSpeed is WindSpeed_d, and City is City_s.
And, we can move this to a table format, too.
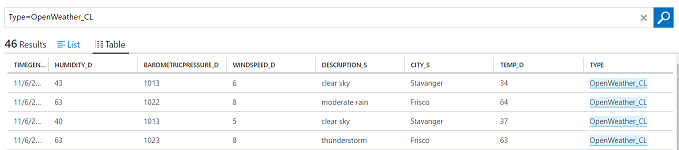
In this script, we receive a variety of metrics: Temperature, Humidity, Wind Speed and Barometric Pressure.
Queries will drive the creation of our solutions. Following were several that I put together to showcase the various metrics which were being gathered.
| Description | Query |
|---|---|
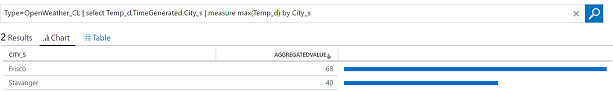
| Temperature for each city of time | Type=OpenWeather_CL | select Temp_d,TimeGenerated,City_s | measure max(Temp_d) by City_s |
| Humidity for each city of time | Type=OpenWeather_CL | select Humidity_d,TimeGenerated,City_s | measure max(Humidity_d) by City_s |
| Wind Speed for each city of time | Type=OpenWeather_CL | select WindSpeed_d,TimeGenerated,City_s | measure max(WindSpeed_d) by City_s |
| Barometric Pressure for each city of time | Type=OpenWeather_CL | select BarometricPressure_d,TimeGenerated,City_s | measure max(BarometricPressure_d) by City_s |
| Count of weather descriptions for a specific city (Frisco) | Type=OpenWeather_CL (City_s=Frisco) | select Description_s, City_s, TimeGenerated | measure count(City_s) by Description_s |
Following is an example of this:
So, how much data does this weather information require in OMS? To find this out, we need to see which solution the HTTP API is associated with. This query gives us that insight for the OpenWeather_CL information that we are gathering.
*_CL (DataType=OpenWeather_CL)
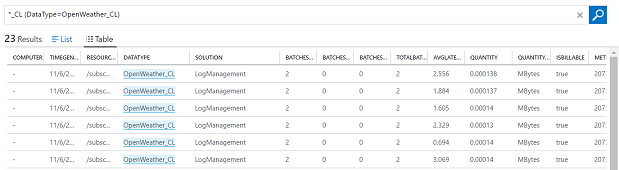
Based on the previous query, it appears that data gathered by the HTTP API is associated with the LogManagement solution. We could use a variation of this query to sum the quantity data to determine the total number of Mbytes gathered by this particular portion of the LogManagement solution. Or, for a rough number, we can use the Usage piece of OMS and then look into how much data the LogManagement solution provides. This would be for all data gathered by the HTTP API, but it gives us a rough idea of the amount of data that’s being collected.
This is part of the data that’s not associated with a computer.
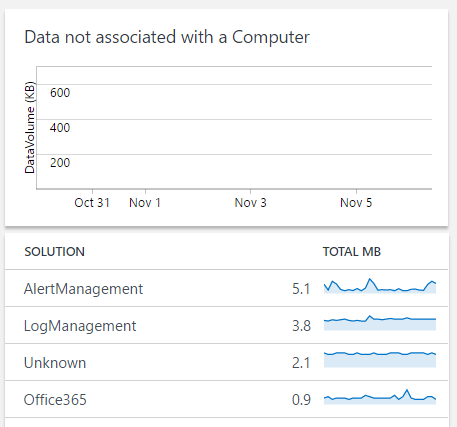
So, if we drill into LogManagement, we get the various types of data that are being collected by the API.
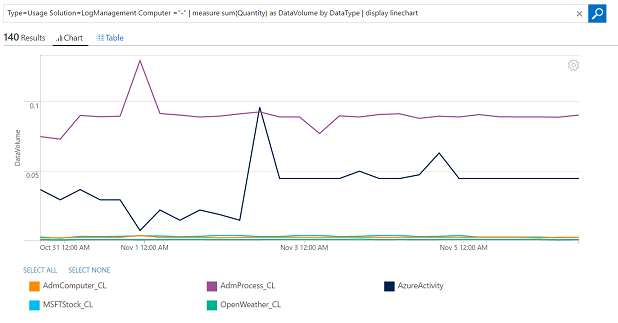
Drilling into this table for the OpenWeather_CL gives us details about what’s gathered for this type of information via the HTTP API.
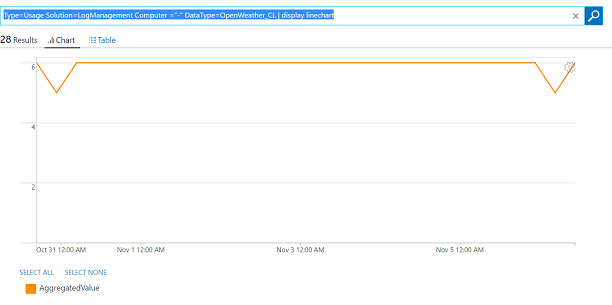
Type=Usage Solution=LogManagement Computer ="-" DataType=OpenWeather_CL | measure sum(Quantity) by Computer
Based on the previous query, the average amount of data gathered by this solution over seven days is 0.024 MB or .003 MB per day or less than .1 MB per month.
This means that the Log Analytics portion of this solution to monitor weather will easily fit within 500 MB per day.
What about dashboards?
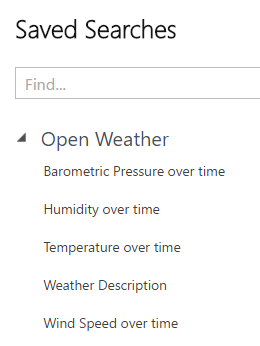
Could we use these queries to populate the My Dashboard page in OMS? Yep, we can do that. To do so, we need to first save our queries to favorites so that they are available for dashboards as shown in the following screenshot.
We can add to the My Dashboard page as we have been able to for a while now by using the My Dashboard icon.

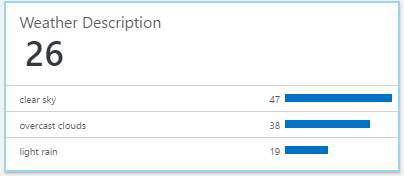
You just add the new dashboard items based on the queries that you saved. A sample of the results is shown in the following screenshot for weather description.
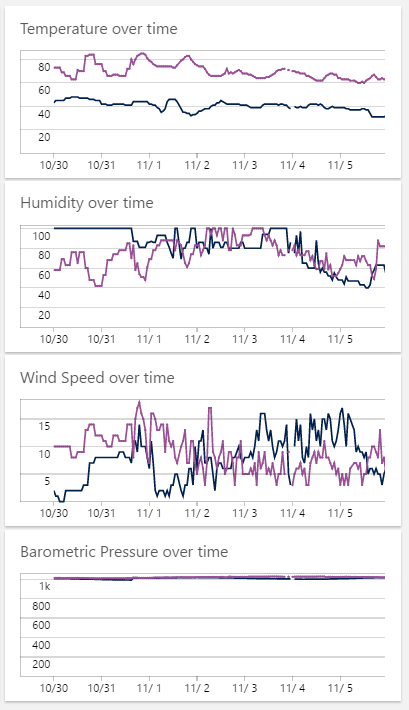
Following are results for temperature, humidity, wind speed, and barometric pressure.
While the My Dashboard functionality is useful, I would recommend minimizing efforts in that area because solutions appear to be where visualization is moving in OMS.
Building a solution based on these queries
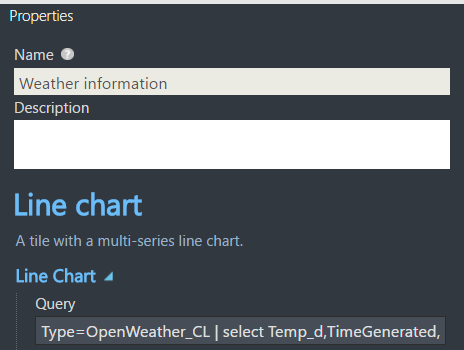
The top-level tile is built from the Line chart option.

Details about the tile are shown in the following screenshot.
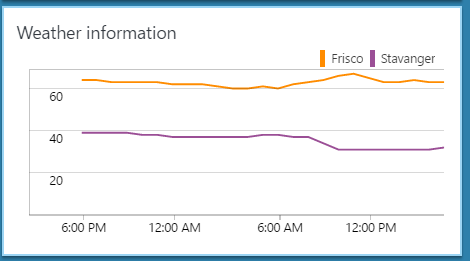
An example of this tile is displayed in the following screenshot.
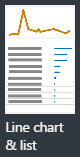
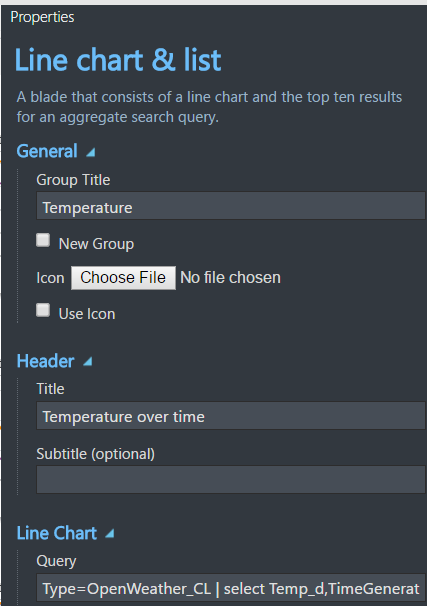
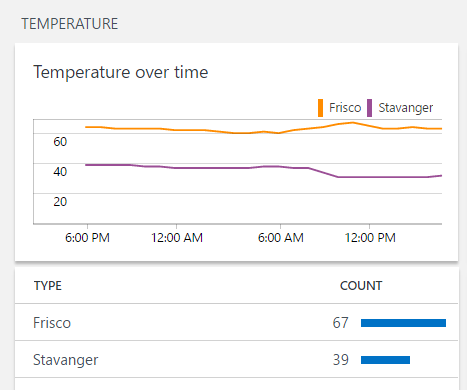
Drilling into this tile gives several views. The first shows temperature over time by using the Line chart and List:
Details for this configuration are shown in the following screenshot.
An example of the temperature view is shown in the following screenshot.
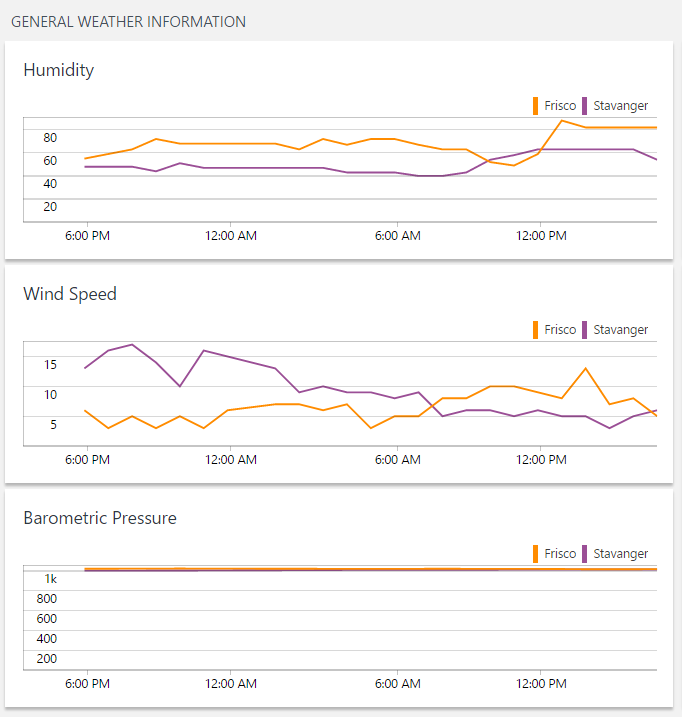
The general weather information (humidity, wind speed, barometric pressure) is visualized through the stack of line charts.
An example of the stack of line charts is shown in the following screenshot.
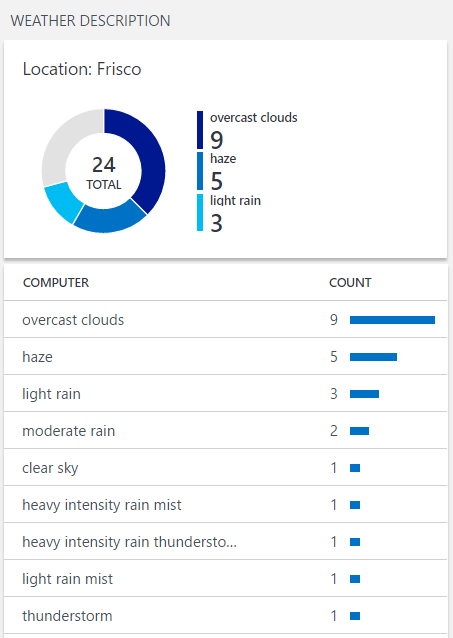
The weather description view is built from the donut and list view.
The weather description information displays like this.
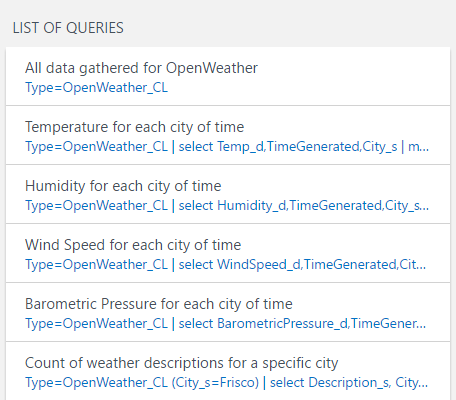
The list of queries is built from the list of queries view.

Each of the queries that were built for this solution or used in this solution were added to the list of queries.
Following is the full solution:
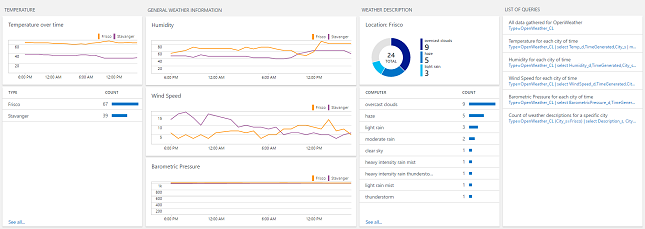
The solution makes it easy to visualize the information that’s being sent to OMS for the various weather metrics we are gathering from Open Weather.
Summary: OMS can gather any type of data that you want by using queries, My Dashboard, and a custom solution to provide intuitive visualization for that data. In the next part of this blog series, we will show how data can be exported from OMS to Power BI and then show examples of how the data can be visualized within Power BI.
Cameron Fuller
Catapult Systems