Arithmetic operations meet aggregate queries in OMS
Summary: Learn how to use arithmetic expressions in aggregate queries in OMS.
Hi everyone, Leyla Kazemi here, and today I want to talk about new OMS functionality that enables you to perform aggregation on arithmetic expressions in OMS. Previously, you were able to use arithmetic expressions in OMS by using the Extend command. However, you could not perform any aggregation on them. This new search functionality will empower you to do much more advanced search queries on your metrics.
Use arithmetic expressions inside the aggregate function
One way to apply mathematics operations is to use them inside the aggregation function. Let’s say that you are bringing your application telemetry from Application Insights, and you want to view the average request duration in seconds rather than milliseconds.
Type:ApplicationInsights TelemetryType=Request ApplicationName=fabrikamoms_ai | measure avg(div(RequestDuration,1000) ) as AvgRequestDurationSec Interval 1HOUR
This query first divides the RequestDuration by 1000 to change the unit to seconds and then calculates the hourly average. The query works fine if you are not using sampling. Let’s say that you are using sampling to reduce telemetry traffic. For every request, there is a SampledCount field, which returns the number of samples that the request represents. The RequestDuration field in this case is the sum of the request durations for those samples. You can calculate the average request duration by dividing RequestDuration by SampledCount. You can then visualize the hourly average by providing the following query:
Type:ApplicationInsights TelemetryType=Request ApplicationName=fabrikamoms_ai | measure avg(div(div(RequestDuration,SampledCount),1000) ) as AvgRequestDurationSecPerSample Interval 1HOUR
This query first divides RequestDuration by SampledCount and then calculates the average for every hour (that is, an hourly average of the per request averages).
Let’s have one more example before moving to the next section. Suppose you want to calculate the maximum of disk writes-per-minute for every disk on your computer. Here is how you can do it:
Type= Perf CounterName="Disk Writes/sec" Computer="BaconDC01.BaconLand.com" | measure max(product(CounterValue,60)) as MaxDWPerMin by InstanceName Interval 1HOUR
Use Extend with the aggregate function
The other way to use arithmetic expressions is to first use the Extend command and then pipe it into a measure command. Continuing on the previous example, let’s say that you are also bringing availability telemetry from your applications. For every record, there is a field called AvailabilityResult, which is either Pass or Fail. The AvailabilityResult is set to Pass if it has passed the availability threshold. You can compare the number of passed tests against the total number of tests at any given time by using the following query:
Type:ApplicationInsights TelemetryType=Availability ApplicationName=fabrikamprod | Extend if(termfreq(AvailabilityResult,"Pass"),1,0) as Result | measure sum(Result) as PassedCount, count() as TotalCount Interval 1HOUR
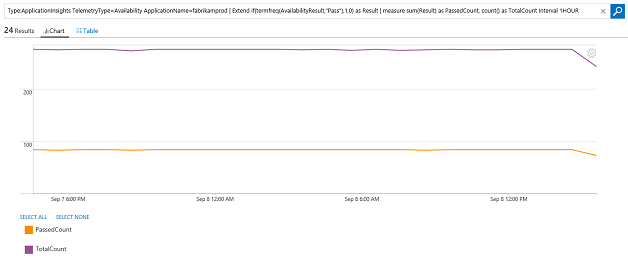
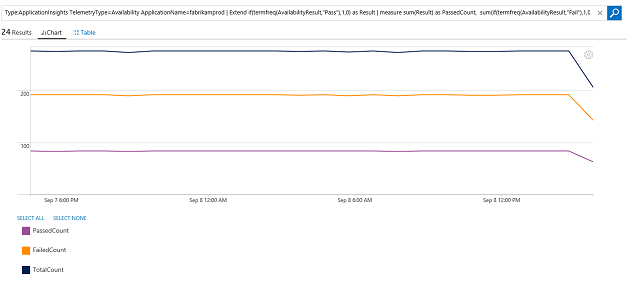
In this example, the Extend command checks the AvailabilityResult field to see if it contains Pass. If so, it returns 1. Otherwise it returns 0. Note that if you use Extend, you need to provide an alias (using as), so that you can refer to it inside your aggregate function. The first aggregate function (sum) then sums the result from Extend to determine the number of passed tests, while the second one (count) counts the total number. If you want to add the failed counts, you can do the following:
Type:ApplicationInsights TelemetryType=Availability ApplicationName=fabrikamprod | Extend if(termfreq(AvailabilityResult,"Pass"),1,0) as Result | measure sum(Result) as PassedCount, sum(if(termfreq(AvailabilityResult,"Fail"),1,0) ) as FailedCount, count() as TotalCount Interval 1HOUR
For the full list of operations, and their definitions, see Log Analytics search reference.
This new functionality can also be used in View Designer, which will enable you to create more advanced views such as complex performance SLAs.
Look for a future blog post from my colleague, Cigdem Kontaci, for more details about how to get your Application Insights data into Log Analytics.
That is all I have for you today. Hope you enjoy this new Log Analytics functionality. Don’t have an OMS account? Get a free Microsoft Operations Management Suite (#MSOMS) subscription.You can also get a free subscription for Microsoft Azure. I invite you to follow the Microsoft IT Management Twitter.
You can also try this out in a live environment!
Leyla Kazemi
Microsoft Operations Management Team