HTTP Data Collector API: Send us data from space… or anywhere!
Summary: Send custom data from anywhere with the new HTTP Data Collector API.
Hey folks,
In my last post, I announced View Designer’s public preview, and today I’m here to talk about another public preview that goes hand-in-hand with it, the Log Analytics HTTP Data Collector API. As the name says, this API enables you to send custom data directly to our Log Analytics endpoint via HTTP. This is perfect for getting any custom data into Log Analytics so that you can query it at hyper-scale with Log Search, make rich dashboards with View Designer, and build your own Alerts with it, too!
Let’s take a quick look at an example PowerShell snippet from the documentation:
#Update customer Id to your Operational Insights workspace ID
$customerId = "abcdefg-abcd-abcd-abcd-abcdefghijk"
#For shared key use either the primary or secondary Connected Sources client authentication key
$sharedKey = "******************************************************************=="
#Log type is name of the event that is being submitted
$logType = "EvanAPITest"
#Field used for time stamp. If time field not specified, assumes ingestion time $TimeStampField = "MyTimestamp"
#Example JSON web monitor object
$json = @"
[{
"slot_ID": 12345, "ID": "5cdad72f-c848-4df0-8aaa-ffe033e75d57", "availability_Value": 100, "performance_Value": 6.954, "measurement_Name": "last_one_hour", "duration": 3600, "warning_Threshold": 0, "critical_Threshold": 0, "IsActive": "true"
}]
"@
#Posts the data to the endpoint
PostData -customerId $customerId -sharedKey $sharedKey -body $json -logType $logType
I’m only going to cover the meat of what folks care about, “How does sending my field=value pairs work?”, in this blog post. The rest of this example, including our C# & Python examples, can be found in our handy Log Analytics HTTP Data Collector API documentation!
#Update customer Id to your Operational Insights workspace ID
$customerId = "abcdefg-abcd-abcd-abcd-abcdefghijk"
#For shared key use either the primary or secondary Connected Sources client authentication key
$sharedKey = "******************************************************************=="
The header to validate your POST will be generated with your Workspace ID and your Workspace Key, referred to as $customerId and $sharedKey here. These can be found under Settings > Connected Sources > Windows Servers.
#Log type is name of the event that is being submitted
$logType = "EvanAPITest"
Next, we need to give the data you’re sending a Custom Log Type, just like the kind we create in Custom Logs. (In fact, you can set your Custom Log Type to be the same as any Custom Log Type you collect today, and they’ll show up together!) This will be used to search for your data in Log Search. In my example, I have EvanAPITest. To search for this, I’ll search Type=EvanAPITest_CL. We’ll show how that looks later in this post.
#Field used for time stamp. If time field not specified, assumes ingestion time
$TimeStampField = "MyTimestamp"
We allow you to set your own Timestamp field here with $TimeStampField. Whatever field you set to be your Timestamp field will permanently become the field that will replace TimeGenerated in your events. If nothing is used here, we default to the time this data is ingested, Ingestion Time.
#Example JSON web monitor object
$json = @"
[{
"slot_ID": 12345, "ID": "5cdad72f-c848-4df0-8aaa-ffe033e75d57", "availability_Value": 100, "performance_Value": 6.954, "measurement_Name": "last_one_hour", "duration": 3600, "warning_Threshold": 0, "critical_Threshold": 0, "IsActive": "true"
}]
"@
Now for the good stuff. All you have to do to define your data is create a JSON Payload.
It’s that simple.
Each object will become its own Log Search event. You may have noticed that we don’t specify the data type of any of the fields here. and that’s because we dynamically determine the data type for you. No cumbersome schema specification, just send-the-data-right-now goodness! Each field becomes a Custom Field associated with your new (or existing) Custom Log Type.
#Posts the data to the endpoint
PostData -customerId $customerId -sharedKey $sharedKey -body $json -logType $logType
Finally, we make the call to PostData with our Workspace ID, Workspace Key, JSON Payload, and the name of our Custom Log Type. The examples in the Log Analytics HTTP Data Collector API documentation will cover the entire function!
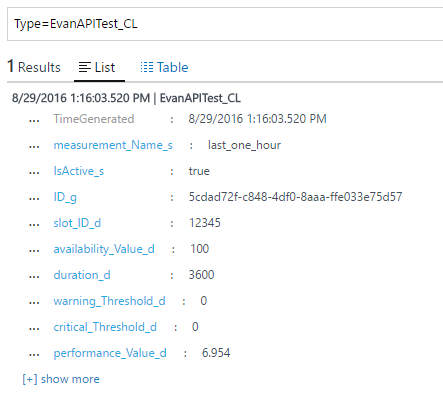
After you perform the POST, we search for Type=EvanAPITest_CL, and here are our fields! All of these fields will work the same way as any others in Log Search, so you can use the full power of Metric charts, Measure commands, and any other capability that Log Search provides.
Now that you’ve seen a sample of the HTTP Data Collector API, check it out! It’s already enabled on all workspaces, so you don’t have to turn anything on in Settings > Preview Features. I hope this helps you to bring your data, wherever it is located, directly into Log Search exactly the way you want it to be, raw and fresh! If it doesn’t, please be sure to create suggestions on UserVoice, or even mail me feedback directly so we can improve the HTTP Data Collector API every day.
Now, go read the Log Analytics HTTP Data Collector API documentation!
Evan Hissey
Program Manager for OMS Log Analytics