Raw searchable performance metrics in OMS
Summary: Raw performance metrics are now available in search.
Good morning everyone, Leyla Kazemi here, and today I am happy to announce that raw performance metrics are now searchable in OMS. Although you could previously collect performance metrics with granularity as low as 10 seconds, the data was aggregated at 30-minute interval. This means that you could only search and create alerts on the 30-minute aggregated data and not on the raw data. With this improvement, instead of pre-aggregating the data, the entire raw data is available in search, and you can choose how you want to aggregate it on the fly.
Awesome! How can I enable raw performance metrics in my workspace?
You don’t need to do anything. This is enabled by default for all workspaces.
How can I view the raw performance metrics in search?
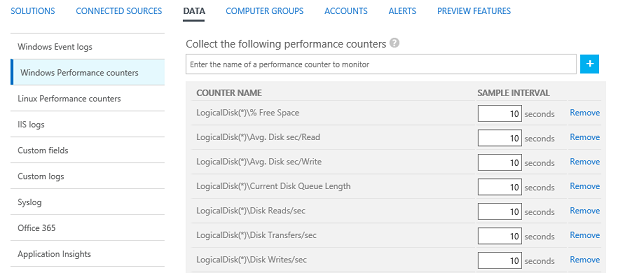
Very simple. Let’s say that you are collecting disk transfers/sec with 10-second sample intervals across all your servers. Here are the counters that you can configure to collect data on the Settings page.
You go to Log Search and provide the following query for one of the computers in the workspace:
Type:Perf ObjectName=LogicalDisk CounterName="Disk Transfers/sec" InstanceName=_Total Computer=FabrikamApp
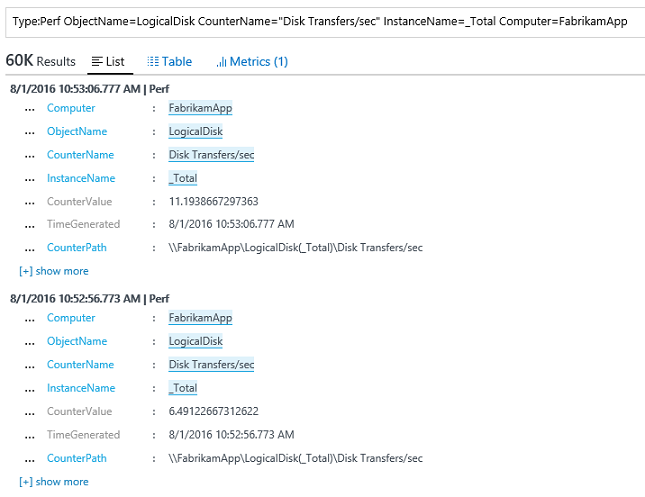
You notice that the performance metrics data is available in raw format, that is, 10s intervals. Previously, you could only see 30-minute aggregated data here.
Now that the raw metrics are available in Search, you can perform any on-demand aggregation on the raw metrics and create alerts. To learn more about how to do an on-demand metrics aggregation query, see On-demand metric aggregation and visualization in OMS.
Let’s say that you are looking at the five-minute average CPU utilization across the top five computers with the highest CPU utilization.
Type:Perf CounterName="% Processor Time" ObjectName=Processor InstanceName=_Total Computer IN {Type:Perf CounterName="% Processor Time" ObjectName=Processor InstanceName=_Total | measure avg(CounterValue) as AVG by Computer | Sort AVG Desc |Top 5} | measure avg(CounterValue) by Computer Interval 5MINUTES
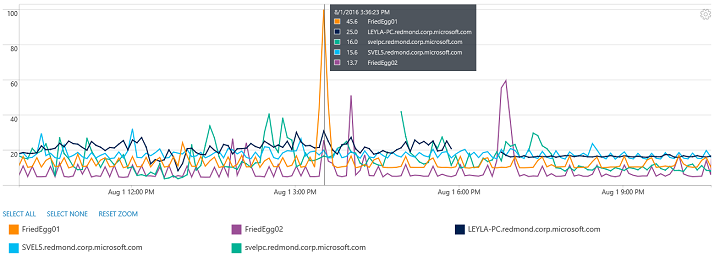
The graph shows that one computer has reached 100% CPU utilization. The next step is to look at the processes for that computer to determine the process that has potentially spiked the CPU.
Type:Perf CounterName="% Processor Time" ObjectName=Process Computer=FriedEgg01 | measure avg(CounterValue) by InstanceName Interval 1Minute
What is the retention policy for the raw metrics?
Previously, we were only keeping the raw data for 14 days. With the new improvement, there is no difference between raw metrics and other data types. Retention is based on your OMS pricing tier. Also, note that you’re only charged once for the data that's being ingested. The OMS pricing model does not charge for the data that’s already stored.
Is this new feature only available for my Windows computers?
Raw performance metrics are now available for both Windows and Linux.
How is my data volume changing with this new functionality?
For a particular computer, a given counter instance (for example, Processor(_Total)\% Processor Time), here is the estimated data volume per day based on different collection frequencies.
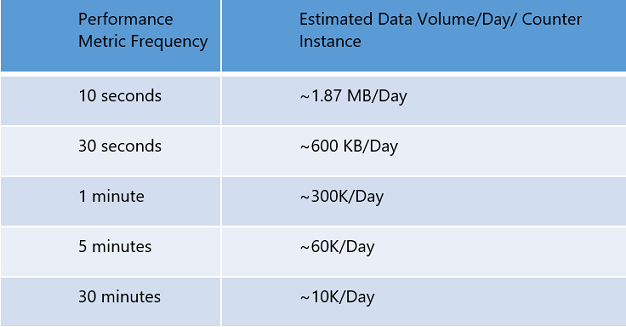
The key advantage with this new functionality is that you can search the exact data that you configure to collect. Previously, an estimated data volume for a given counter instance was ~1 MB/day/counter with 10 second frequency. However, for every 180 samples (6/min * 30), only the aggregated point (that is, average across 30-minute interval) was searchable. With this new change, all the 180 raw data points are searchable, while the data volume is only increased .87 MB/day.
How can I keep/lower my previous data volume?
Use less granular interval. For example, if you’re collecting 10 second interval performance counters, you can change the collection interval to 20 seconds, which reduces your overall data volume. Even by lowering the data volume, you will have the added functionality of being able to search and query at a more granular level than you could before.
I invite you to follow the Microsoft OMS Facebook site. If you want to learn more about Windows PowerShell, visit the Hey, Scripting Guy Blog.
Get a free Microsoft Operations Management Suite (#MSOMS) subscription so that you can test it out. You can also get a free subscription for Microsoft Azure.
Leyla Kazemi
Microsoft Operations Management Team