Use OMS View Designer for SQL Server monitoring
Summary: Learn how to use OMS View Designer to create a custom SQL Server monitoring solution.
Good morning, everyone. Manjnath Ajjampur is here, and, in my role as a Cloud Infrastructure Architect at Microsoft, I focus on our Hybrid Cloud solutions where I partner with our customers who are implementing Microsoft Operations Management Suite. Recently, one customer wanted to understand how to gain better visibility into their SQL Server environment. Specifically, the customer was interested in the SQL Server jobs that failed or succeeded and who was running those jobs. I decided to use the OMS View Designer to create a solution for them.
Design the solution
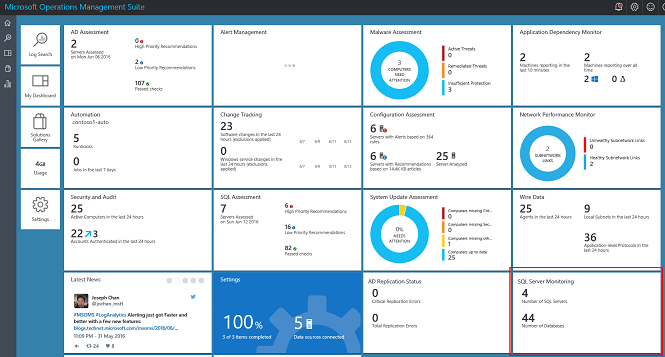
So here it is. The OMS home page has a tile for SQL Server Monitoring. It shows the number of SQL Servers and the total number of databases being monitoring.
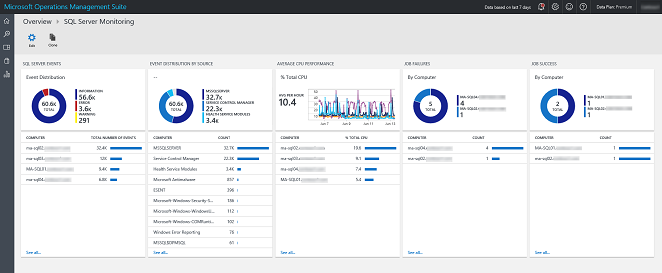
Drilling down into that tile brings you to the SQL Server Monitoring view.
In this blog post, I will show you how to set up OMS and SQL Server to collect and to process specific Event Log entries to leverage the View Designer capability in OMS.
Set up SQL Server to write Agent job events
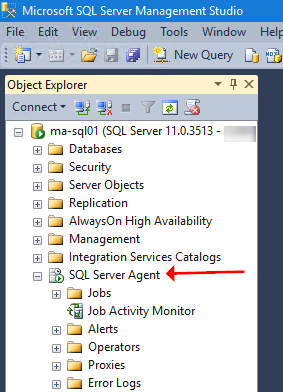
- Ensure that the SQL Server Agent is running on the SQL Server instance whose jobs you want to monitor.
- Ensure that you edit the job’s properties so that it writes to the Windows Event log. In this example, I have a simple job that creates a disk-based backup of a database named “vFirewall”. This job will fail if the backup location (c:\temp) does not exist.
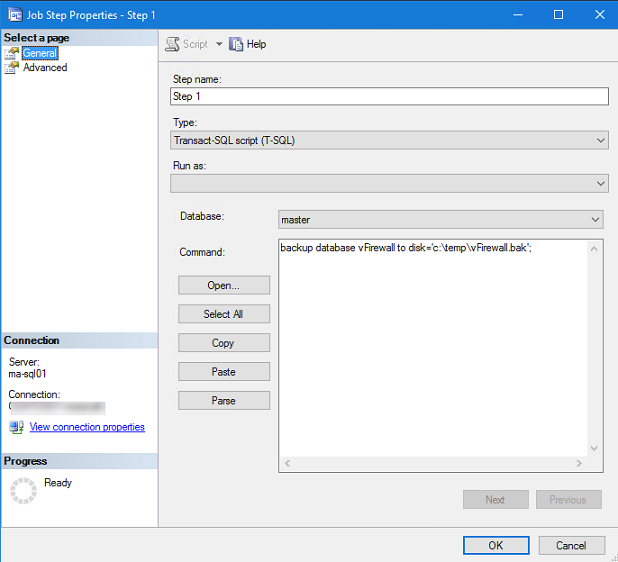
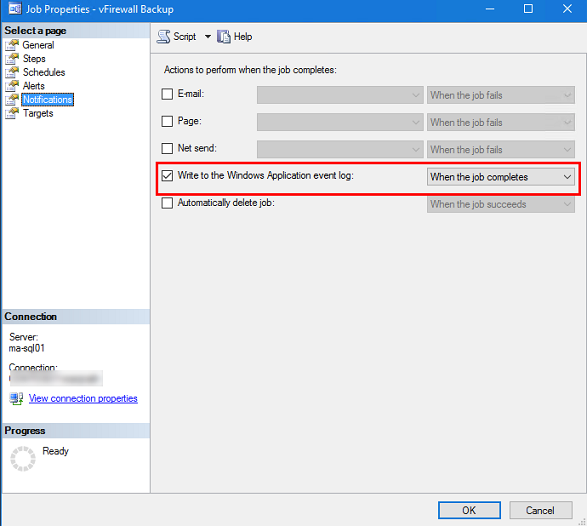
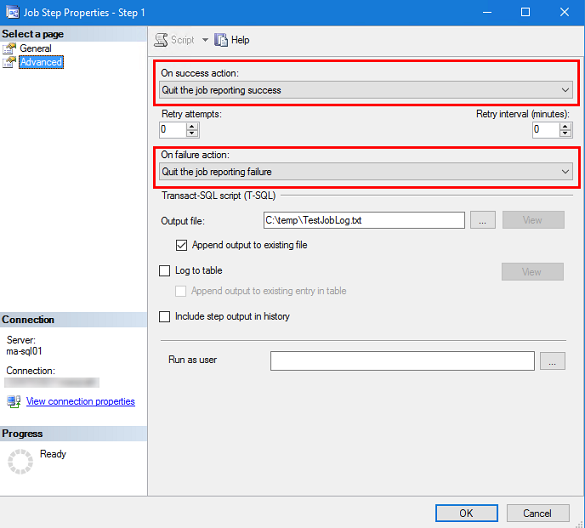
Optionally, you can have the SQL Server job write its output to a text file. More on that later.
Configure OMS
- Install and configure the OMS Windows Agent on SQL Server. For setup instructions, see Connect Windows computers to Log Analytics.
- Deploy the SQL Server Assessment solution for OMS.
- Deploy the View Designer to your OMS workspace. The View Designer is currently in Preview. To add it, go to Settings > Preview Features, and then enable View Designer. Please read the caveats about deploying Preview Solutions.
- Create a OMS Computer Group that represents the SQL Servers that I want to monitor. I call mine (very creatively) SQL Servers.
Creating the custom view for SQL Server
Now that you have met all the prerequisites, the next step is to use the View Designer to create the SQL Server Monitoring Overview dashboard. The View Designer allows you to create the Overview tile that is viewed on the OMS Home Page. Drilling into this tile reveals the Monitoring dashboard. It relies on Log Analytics search queries.
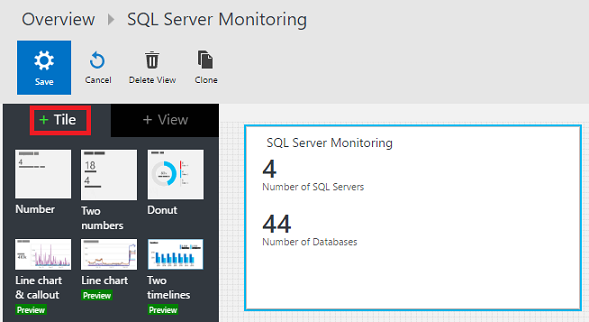
The View Designer has two tabs – Tile and View. Both the Tile and the View tabs provides ways to visualize data in a variety of chart types and formats.
Let’s focus on the Tile tab. There are a variety of data visualization options here. I choose Two Numbers.
The queries that I use to populate this tile depend on the SQL Server Assessment Solution.
| Label | Query |
|---|---|
| Number of SQL Servers | Type=SQLAssessmentRecommendation AffectedObjectType="Microsoft.SQLServer.DBEngine" | measure count() by Computer |
| Number of databases | Type=SQLAssessmentRecommendation | measure count() by DatabaseName |
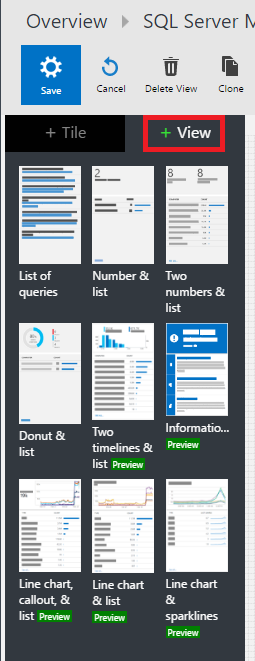
If you drill into this tile, you see the main SQL Server Monitoring Dashboard. If you click the View tab in the View Designer, you see a canvas where you can choose multiple data visualization options.
Here’s what I use to populate the main dashboard. SQL Server Agent job failures are written to the Windows Application Event log as Event ID 208. Event Level of Warning. job successes are written to the same log with Event ID 208 and Event Level of Information.
| Name | Type | Query | Navigation query | ||
|---|---|---|---|---|---|
| SQL Server events | Donut & List |
|
{selected item} Type=Event | ||
| Event distribution by source | Donut & List |
|
{selected item} | ||
| Average CPU performance | Line chart, callout, & list |
|
{selected item} | ||
| Job failures | Donut & List |
|
{selected item} Type=Event (EventLog=Application) (EventID=208) (EventLevelName=warning) | ||
| Job success | Donut & List |
|
{selected item} Type=Event (EventLog=Application) (EventID=208) (EventLevelName=information) |
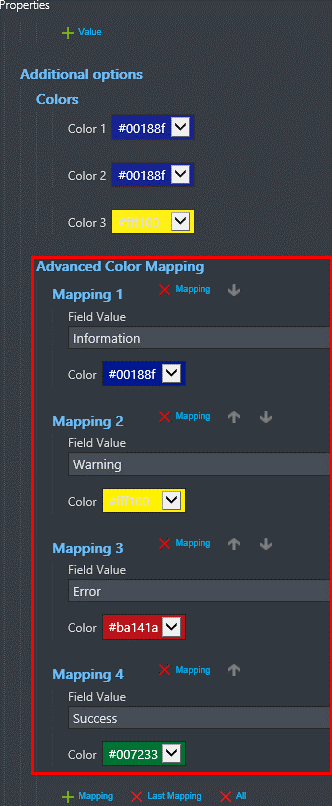
Additionally, I color-coded the donut sectors to provide a visual indication of Errors and Warnings by using the Advanced Color Mapping functionality for each donut. For example, for the SQL Server Events donut, I used these color mappings.
You should save this dashboard so that the main tile and the underlying dashboard can now become part of your OMS workspace.
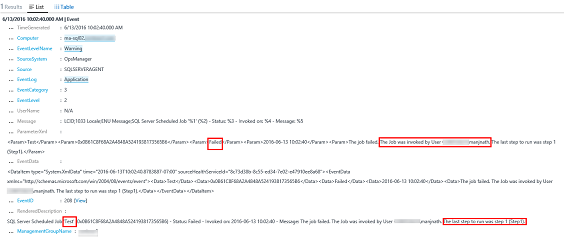
That’s it! Now you can start to monitor your SQL Server environment for Agent job successes and failures. When I drill into any job failure, I can see what job failed, at what step, at what time, and who ran the job.
Closing thoughts
- You have just extended the already awesome functionality of Log Analytics in OMS with a custom view that is meaningful to your database team.
- This view relies on the SQL Server Assessment solution. By default, the assessment runs every seven days. This means that you will discover new SQL Servers and databases once every seven days. If you have a System Center Operations Manager environment, you can create an override to the collection rule to have it run on a more frequent basis. Our engineering team is looking into providing this override functionality outside such an environment as well.
I invite you to follow me on Twitter and the Microsoft OMS Facebook site. If you want to learn more about Windows PowerShell, visit the Hey, Scripting Guy Blog.
Get a free Microsoft Operations Management Suite (#MSOMS) subscription so that you can test it out. You can also get a free subscription for Microsoft Azure.
Manjnath Ajjampur
Principal Cloud Infrastructure Architect, Microsoft