OMS alerting is now generally available
Summary: Microsoft Operations Management Suite alerting has moved from preview mode to generally available status.
This post is the first post in a multi-part series of blog posts about OMS alerting. To fully understand this post, you should read the entire series in order.
Here are the posts in the series:
- OMS alerting is now generally available
- Learn how to get started using OMS alert management
- Use OMS to create alerts for missing security and other updates
- Set up an Operations Management Suite alert that detects suspicious executables
- Use the OMS log search feature to report on custom OMS alerts
Good morning everyone, Alex Frankel from the OMS team here. In early December, we released alerts as a public preview. We’ve seen lots of workspaces create some interesting alerts over the past few months and, working with customers, we’ve gathered a lot of great feedback. If you’ve been paying close attention over the past few weeks, you’ve seen a bunch of new additions to the OMS Alerts feature. While we’re not done working to make alerts best in class, we’re ready and eager for everyone to get their hands on it.
What’s changed since you first released the public preview?
A lot! In addition to a host of bug fixes, here are some of the new improvements:
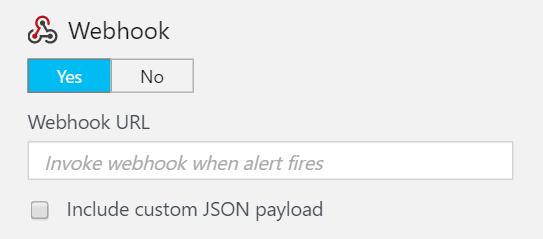
WebHook support: Provides a WebHook URL to send alerts to. This makes it easy to integrate with other tools like Slack or a wide variety of incident management tools. WebHook support is so cool and important that it has an entire blog post dedicated to it.
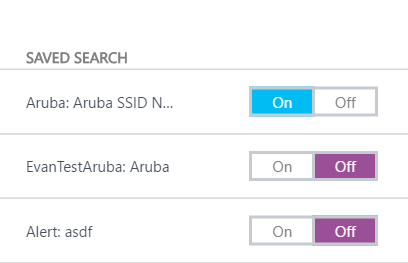
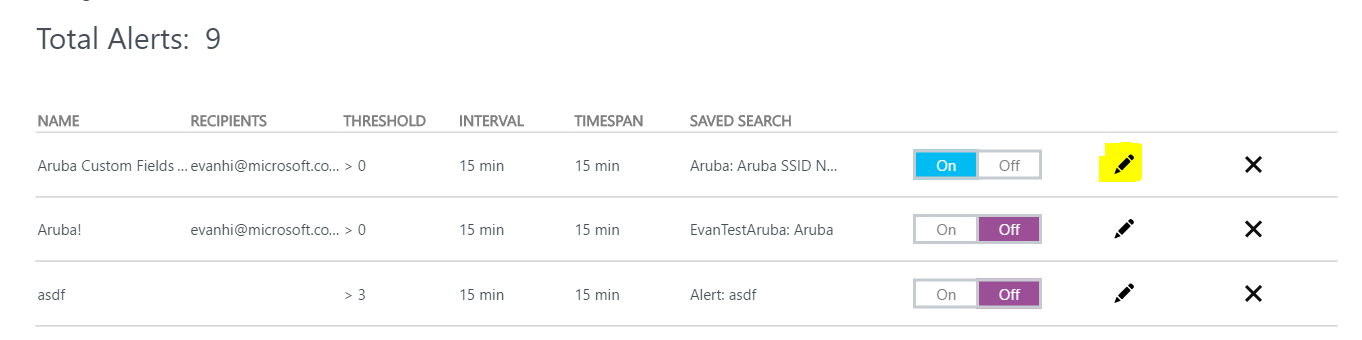
Turn alerts on or off: In Settings > Alerts, you can now turn individual alerts on or off. This makes it easy to turn off a noisy alert and turn off an alert during a maintenance window.
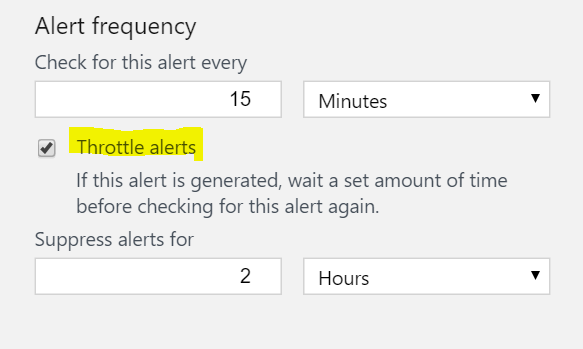
Alert throttling: Set an alert to stop firing for a period of time after the alert fires. This helps reduce noise from alerts.
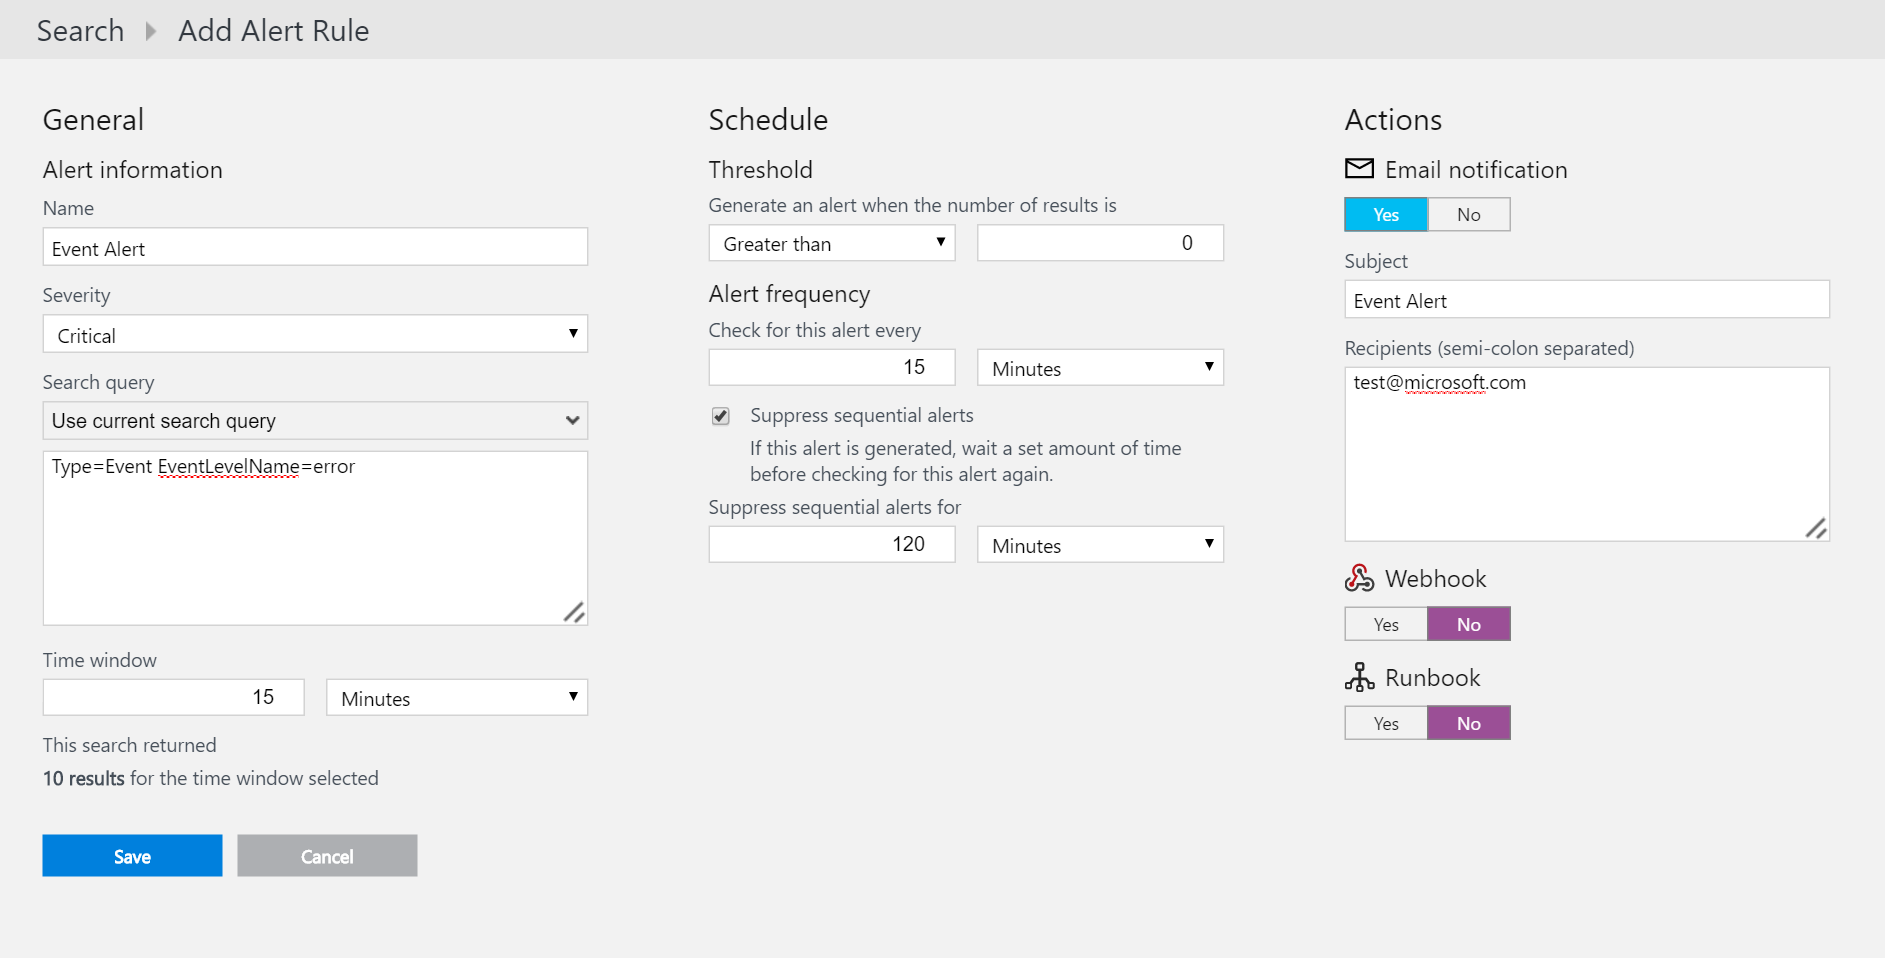
New alert creation user experience: Enjoy some extra room to breathe when you configure your alert. You’ll continue to see us revise this user experience in the coming months.
Performance improvements : The maximum search time window is now 24 hours. It was previously one hour.
Alert “Bell” icon in the header: Now when you visit your OMS workspace, we’ll show you how many alerts have fired since you left. There’s a link to view all the fired alerts in search.

Edit an alert. To edit an alert, select the edit icon in Settings > Alerts.
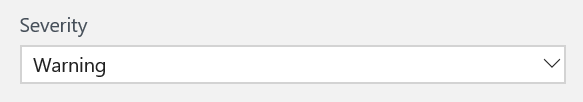
Alert severity: Choose among three levels of severity for an alert: error, warning, or info.
Wow, that is a lot! Does this mean you’re done working on alerts?
Heck no! Alerting is a fundamental piece of any good monitoring tool, which means we’re constantly going to be iterating and improving the capabilities of OMS Alerts. Particularly over the next few months, you’ll see us move aggressively to reduce the time to fire an alert and overhaul the Alert Management Solution to provide a more cohesive alert monitoring and management story.
Any tips for getting started?
Even though alerts require you to write search queries, you don’t need to know any of the search syntax to use alerts. The easiest thing to do is go to to search from a solution.
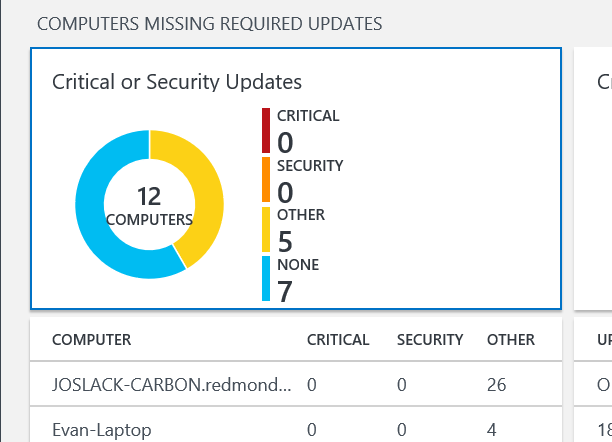
Now we’re in search, and that same query has already been input added to the query box. We can see that five computers are missing required updates.
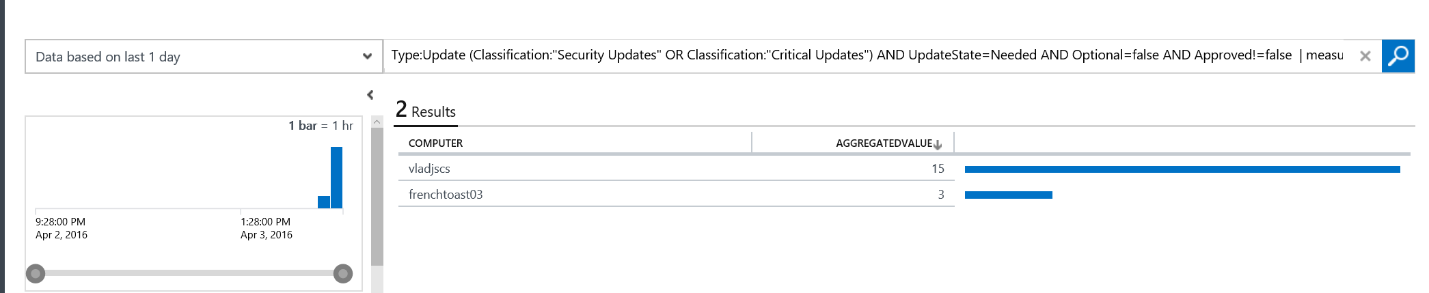
All you need to do now is configure the alert by selecting the Alert button in the search taskbar. We can leave the schedule and time window fields on the default time of 15 minutes. Because I want to know when any computer is missing a required update, I’ll set my threshold to Greater than 0.
At this point, you can choose to send an email message, call a WebHook, or run an Automation runbook. That’s it!
Any other good alert queries to start with?
Here are some other helpful alert queries to get you started, as well as any solutions or other data sources that you might need for that query:
| Name | Query | Alert configuration | Required solution/data source | |||||
|---|---|---|---|---|---|---|---|---|
| Computers missing required Critical or Security updates | Type=Update UpdateState=Needed Optional=false (Classification="Security Updates" OR Classification="Critical Updates") |
|
System Update Assessment | |||||
| More than 5 software changes in the last 24 hours | Type=ConfigurationChange ConfigChangeType=Software |
|
Change Tracking | |||||
| Suspicious executable discovered | Type=SecurityEvent EventID=8002 Fqbn:"-" | Measure count() as ExecutionCountHash by FileHash | Where ExecutionCountHash <= 5 |
|
Security and Audit | |||||
| A process of has initiated a restart of a computer | Type=Event EventID=1074 Source=User32 |
|
Collect “System” logs in “Settings -> Data -> Windows event logs” | |||||
|
Computer= <computer name> Type=Perf ObjectName=Memory CounterName="Available MBytes" | measure avg(CounterValue) by Computer interval 30minute | where AggregatedValue<1024 |
|
Collect the “ \Memory(*)\Available Bytes” performance counter in “Settings -> Data -> Windows Performance Counters” | |||||
|
Computer= <computer name> Type=Perf ObjectName=Processor CounterName="% Processor Time" | measure avg(CounterValue) interval 30minute | where AggregatedValue>90 |
|
Collect the “ \Processor(*)\% Processor Time” Settings -> Data -> Windows Performance Counters | |||||
|
$ComputerGroups[GroupName] Type=Event EventID=7036 |
|
Collect “System” logs in “Settings -> Data -> Windows event logs” |
Of course, learning the search syntax will only help you create more effective alerts. Here’s some helpful documentation and blog posts:
Anything else you’d like to share?
Keep the feedback coming. Submit your ideas to UserVoice, take our monthly surveys, and you can always email me at alfran@microsoft.com. Happy alerting!
I invite you to follow me on Twitter and the Microsoft OMS Facebook site. If you want to learn more about Windows PowerShell, visit the Hey, Scripting Guy Blog. If you have any questions, send email to me at scripter@microsoft.com. I wish you a wonderful day, and I’ll see you tomorrow.
Alexander Frankel
Microsoft Operations Management Team