Integrating OMS and Power BI
Summary: Learn how to integrate Power BI with Microsoft Operations Management Suite (OMS) by activating the integration and creating a dataset to work with the data.
Hi all, Daniel Örneling here. Usually I spend my days working as a specialist consultant involved in several projects around Systems Center Operations Manager and Operations Management Suite, both directly connected to OMS and connected through SCOM. I´ve had the opportunity to write a guest blog for the OMS team, and what can be a better way to share your knowledge? That´s why I will today explain to you how to export data from OMS to Microsoft Power BI and create a really good looking report.
The Power BI integration with OMS recently stepped into a public preview, and I think it took me about 30 seconds from reading the words, OMS, Power BI, and public preview. before I had logged into my OMS workspace and activated the preview feature. So, what’s to do after the preview feature had been activated? Well, keep reading and you´ll find out.
Activate the Power BI integration
The first thing you need to do after you´ve signed in to your OMS workspace is to head to the Settings of your workspace. Just click the button seen below.
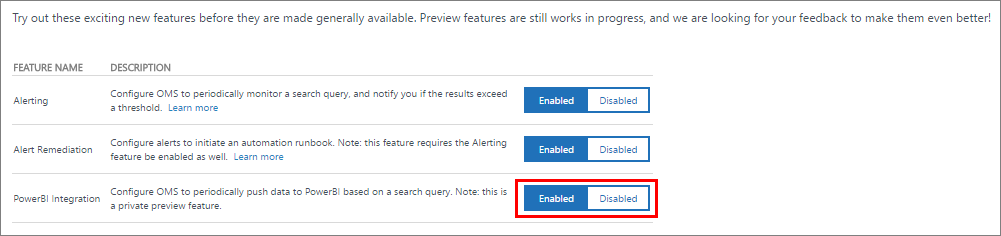
Now, the following menu will come in handy three times during this blog. The first thing to do is to head to Preview Features.

Switch the PowerBI Integration to Enabled as seen below, and you´re almost good to go.
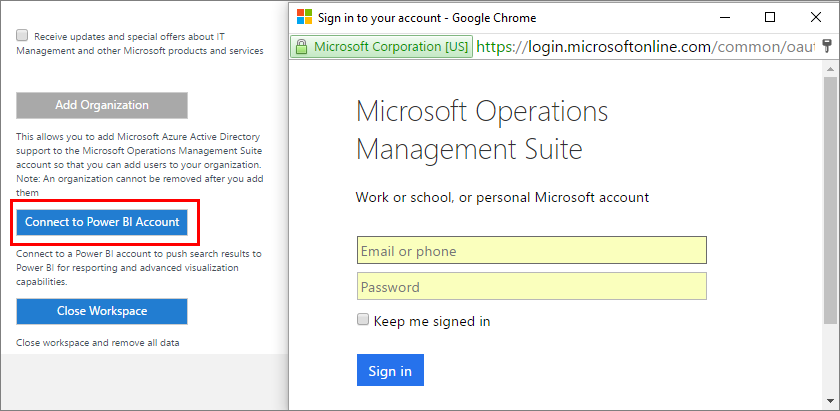
Now, go to Accounts from the menu.

Select Connect to Power BI Account, sign in by using your Office 365 account, and you´re all set for the Power BI integration.
Create a dataset
Okay, so the integration has been set up, and we´re about to export our data to Power BI. Go to Log Analytics search by selecting Log Search from the main page.
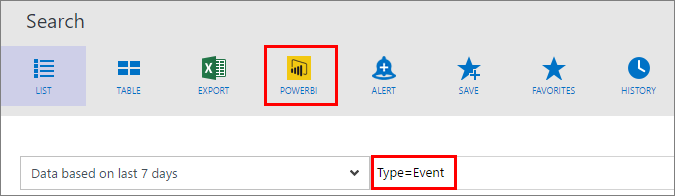
The dataset I will create for this demo will contain event information such as Event IDs, event level names, event logs, and so forth. Just type Type=Event and press Enter to search. After you´ve verified that the search actually generates information, select PowerBI as seen in the following picture.
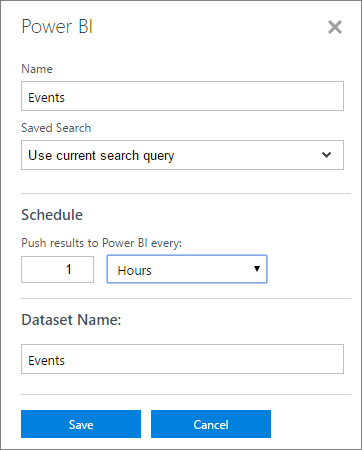
My dataset will simply be called Events, I will use the current search query (Type=Event), and I want the data to be shipped every hour. This rate can be adjusted down to every 15 minutes as the fastest schedule. Bear in mind that shipping data every 15 minutes might cause syncing errors due to the (potentially) heavy load of data.
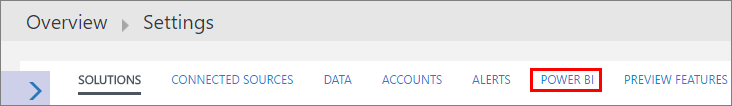
It can take up to 15 minutes before the dataset is created in Power BI, and your information has been transported. In the meantime, we can check our datasets out inside OMS. Head back to the Settings pane. This time, select Power BI.
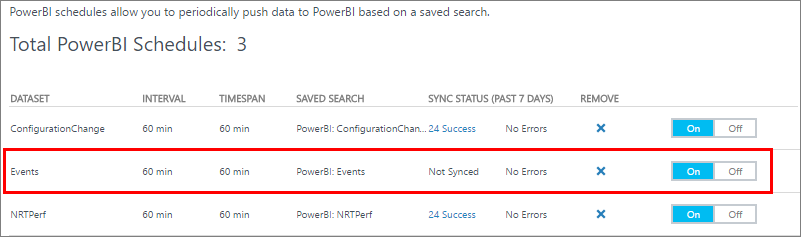
There it is, our dataset that we´ve just created along with a couple of other datasets I´ve created. The only difference among the datasets is that the queries differ. I´ve used Type=ConfigurationChange and Type=Perf instead and created datasets for those just as I showed earlier so it´s really easy to create the datasets. You will also see these datasets in Power BI later in this post.
Work with the data in Power BI
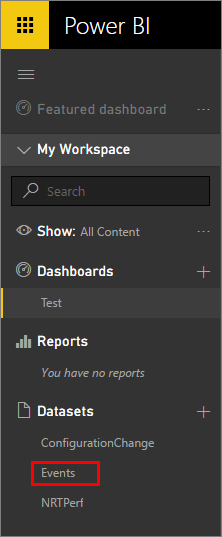
Go to PowerBI.com, and sign in with your Office 365 account. I used my corporate account because that´s where I have my Office 365 benefits. After you´re logged in, select the menu button ( ) to bring out this view, and you will now be able to see your datasets. Here you can also see my other two datasets that I had created earlier.
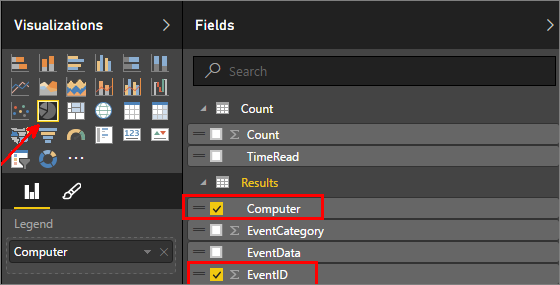
Now what I want to do is to create a diagram containing information on the number of events per computer in my environment. Select the Pie Chart model, and then check Computer and EventID as seen in the following screenshot.
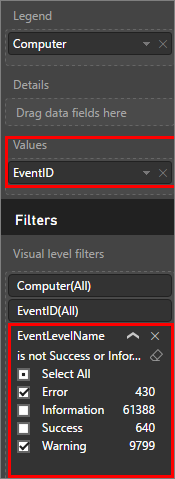
Now there are two things left to do before this starts to present some interesting data. Drag EventID to Values as I´ve done in this screenshot, and then make a filter for the EventLevelName parameter. In this case, I want to show only errors and warnings in my report. You could also filter the computer names if you like. This way you wouldn´t have to show all computers in your environment.
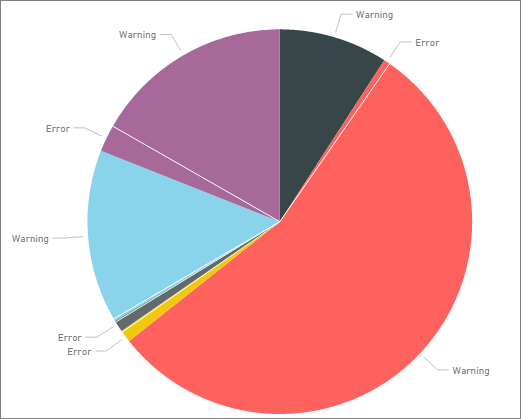
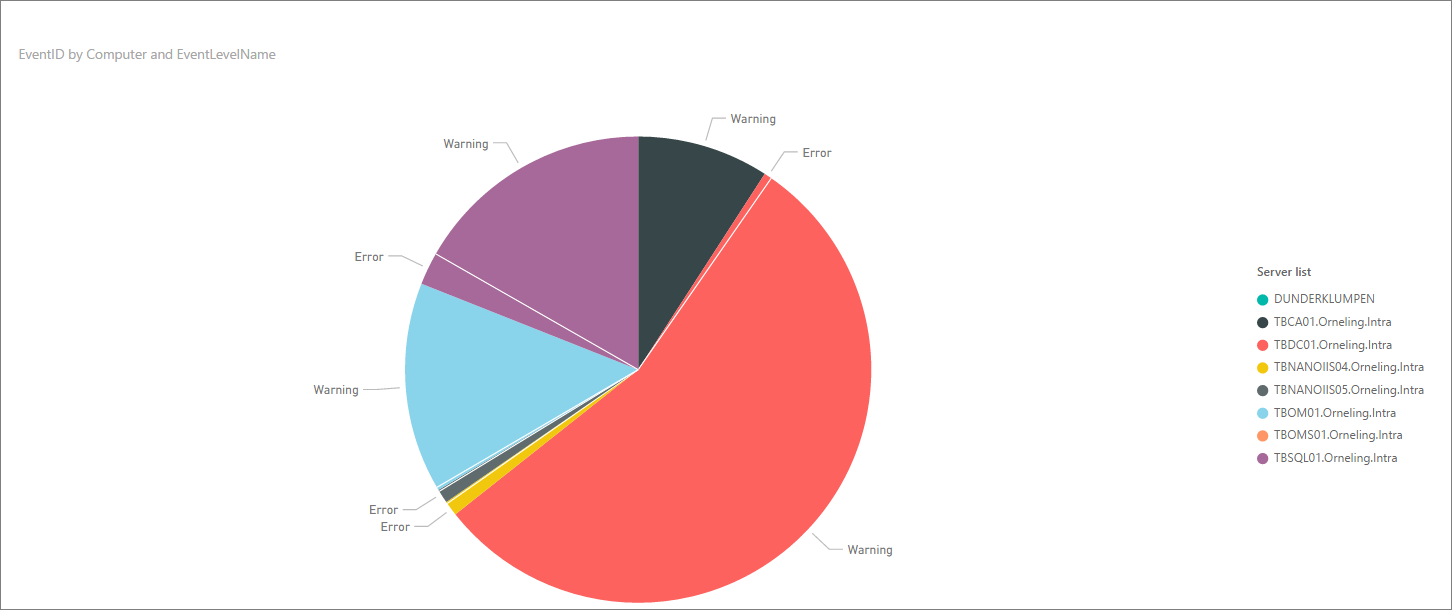
Now that the information is there in our report, we will see the following diagram. Looks fancy, but don´t we want some information about which color represents which server?
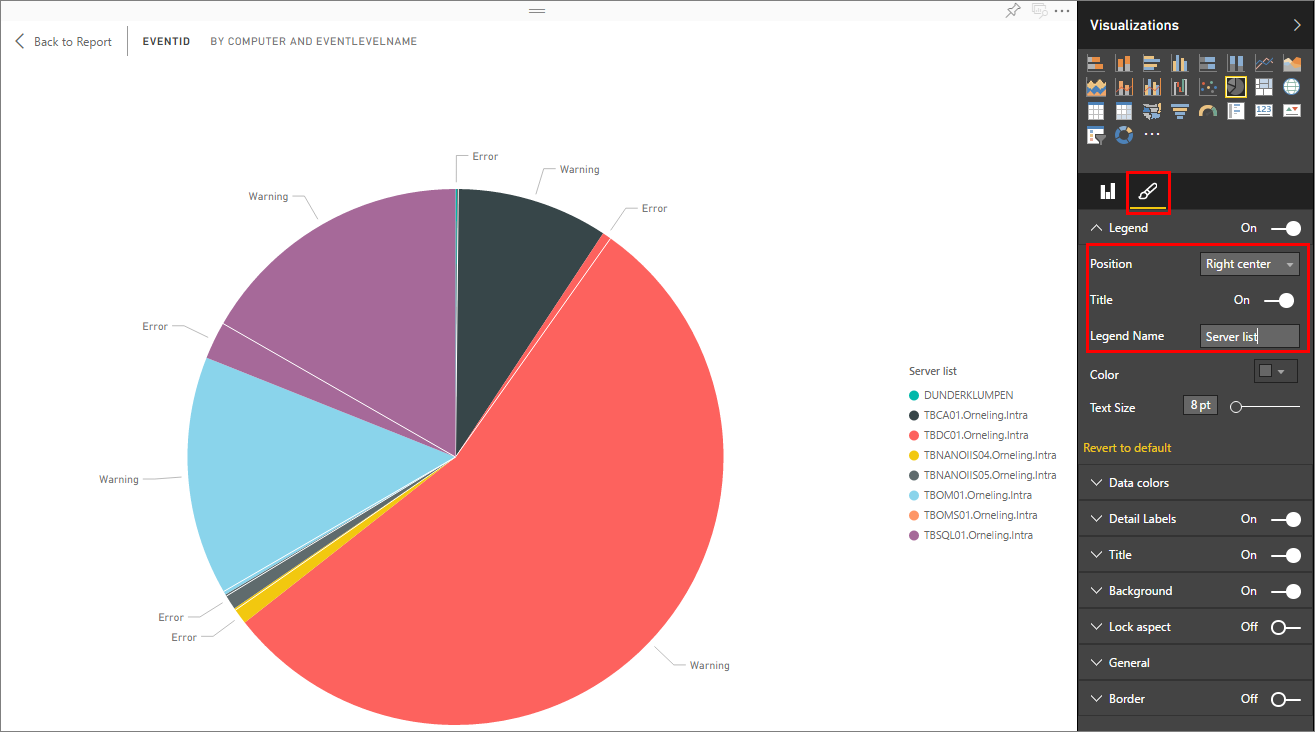
Select the format icon (the pencil) to the right, turn on Legend, choose Right center (or whatever you want), and give it an appropriate name. You will now see the server list in the report as well.
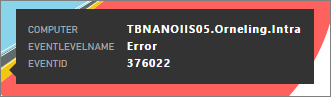
Now you can hover over a field with your mouse, and you will see the server name (Nano server in OMS, pretty cool, ain't it?), the event level name, and the number of events on that server (the high amount of errors is expected in this case).
Now save your report, and you will be able to do all sorts of Power BI stuff with it, exporting it to Excel, publishing it to websites, etc.
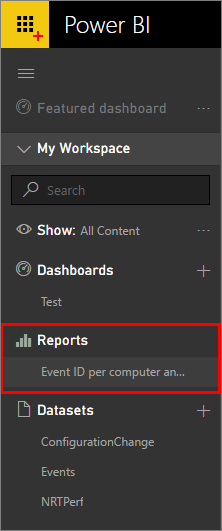
Select the report name, and there it is, our very own Power BI report completely based on information that we´ve gathered from OMS with the help of a connector between the two services.
Summary
What I´ve shown here in this blog post is how you, in a very fast (and easy) way, can set up recurring shipment of your OMS data to Power BI where we can create really fancy reports in just a minute. With OMS as the gatherer and Power BI as the reporting tool, our life is made much easier when it comes to presenting the data to the rest of the business. So if you have been waiting for a great way to create reports based on your OMS data, this is your answer.
That´s all for now, folks. I hope you´ve liked what you´ve read and that you will find this blog post useful to get started with the Power BI integration. Leave a comment below if there are questions.
Thank you, Daniel, for an awesome blog post. It is both informative and useful. Join me tomorrow when we will have another article from Alexander Frankel as he talks about exporting data to Power BI.
I invite you to follow me on Twitter and the Microsoft OMS Facebook site. If you want to learn more about Windows PowerShell, visit the Hey, Scripting Guy Blog. If you have any questions, send email to me at scripter@microsoft.com. I wish you a wonderful day, and I’ll see you tomorrow.
Ed Wilson
Microsoft Operations Management Team