Add counters to near real-time data collection in OMS
Summary: Learn how to add various counters to near real-time performance data collection in Microsoft Operations Management Suite.
Good morning everyone. Ed Wilson here, and today I want to talk about adding various performance counters to near real-time performance data collection in Microsoft Operations Management Suite (OMS).
Note This is a five-part series that includes the following posts:
- Near real-time performance data collection in OMS
Learn about setting up and using near real-time performance data. - Add counters to near real-time data collection in OMS
Learn how to add various counters to near real-time performance data. - Use OMS Search to visualize collected performance data
Drill in to a graph that shows metrics about your computer. - Filter OMS near real-time performance counter data by computer
Use Log Search to filter near real-time performance counter data by computer name. - Use OMS near real-time performance counters to check one counter
Check the status of a single counter across all your systems.
I can add a counter for a particular instance or for all instances of a performance counter. To add all instances of a particular counter, I specify the object (such as logical disk, network adapter, process, or processor), and then I specify the particular counter I am interested in.
Some counter names are percent of processor time, bytes total per second, and disk reads per second. If I want all instances of a counter, I can use one of two formats:
- Object name\Counter name
- Object name(*)\Counter name
Here are some examples:
- LogicalDisk(*)\% Disk Time
- LogicalDisk\% Disk Read Time
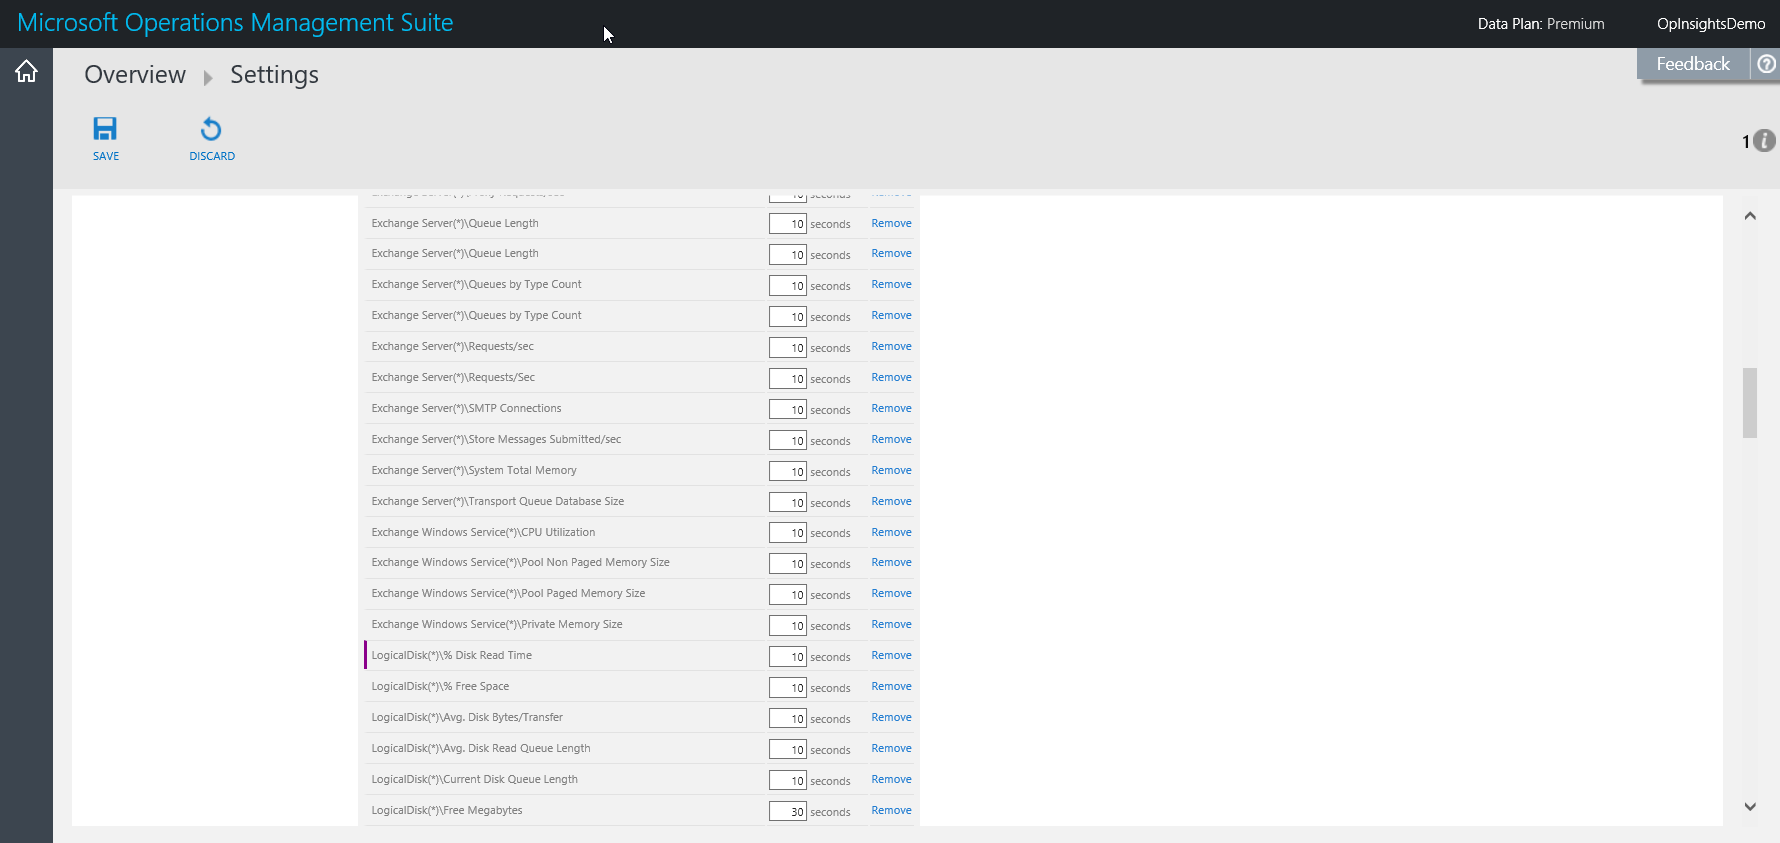
If I use the LogicalDisk\% Disk Read Time format, when I add it (by selecting the blue + sign) the following information appears:
When I go to select the collection interval, however, I see that the format translates to the LogicalDisk(*)\% Disk Time format automatically:
If I am not sure as to the name of an instance, I can always take a clue from the Perfmon tool that has been installed in Windows since the NT days. Here is an example of the LogicalDisk object from my Windows 10 laptop:
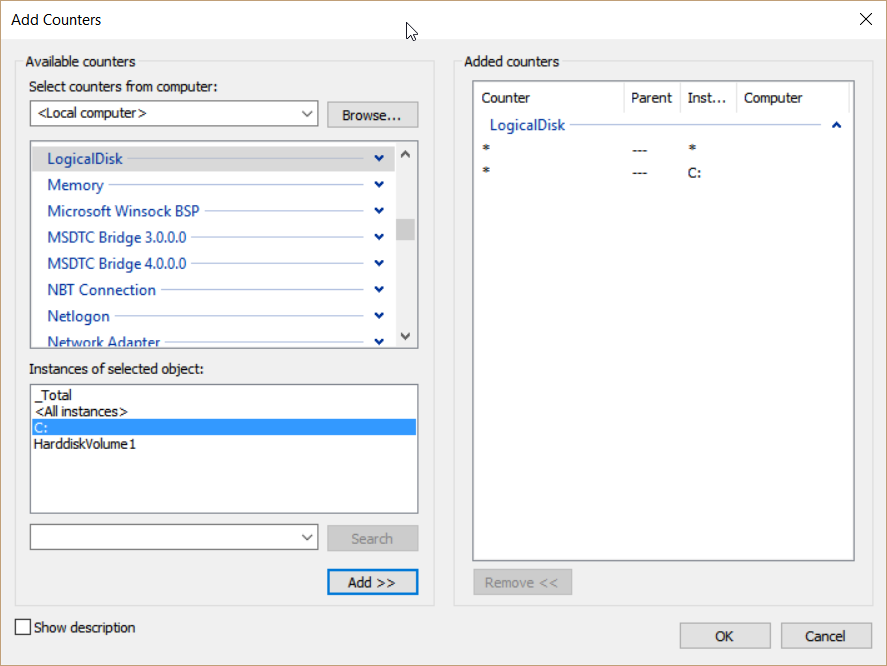
Notice that the instance for drive C is C: , not C or C:\ . So this is what I add in my performance data collection tool in OMS:
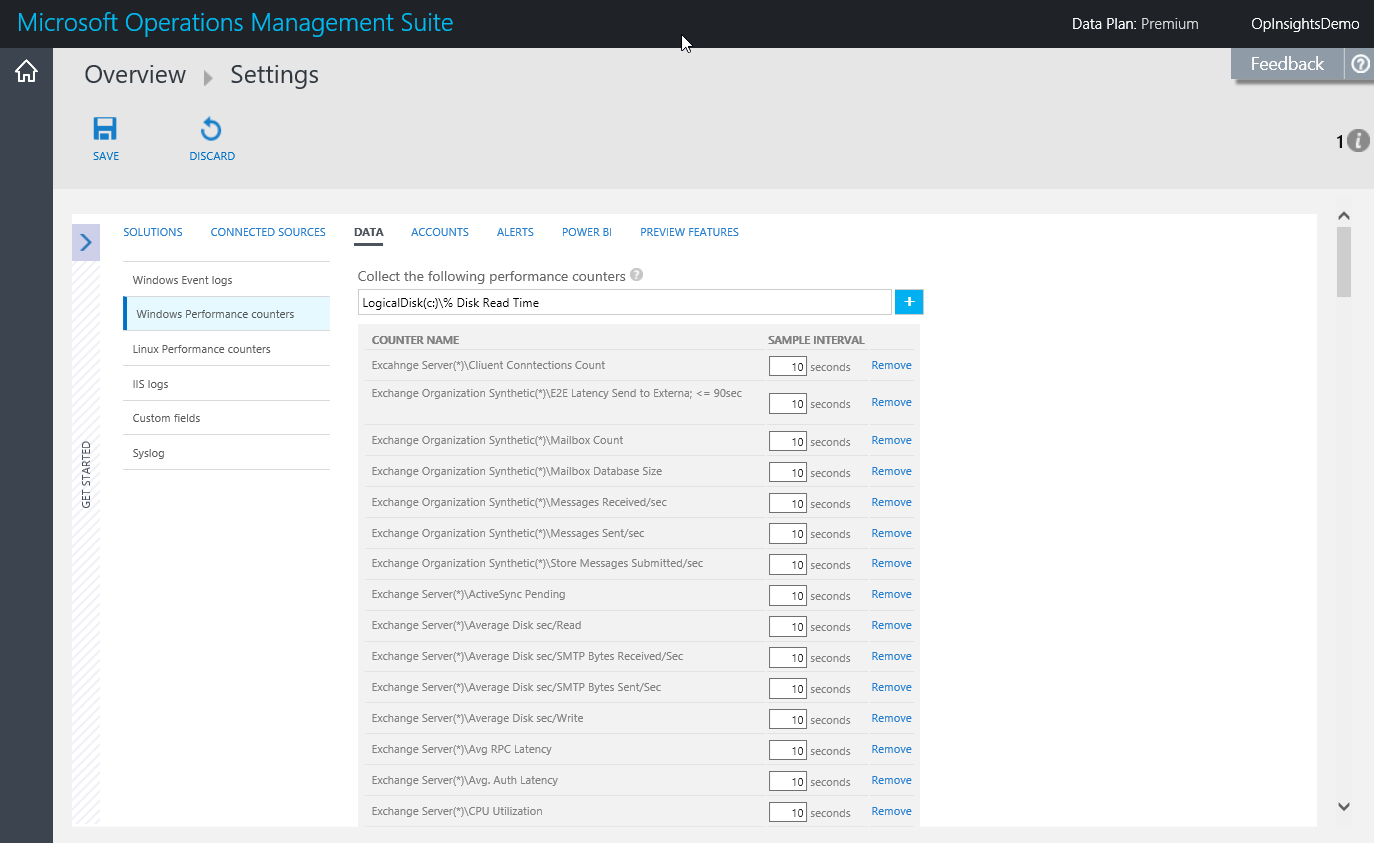
LogicalDisk(c:)\% Disk Read Time
This screen is shown here:
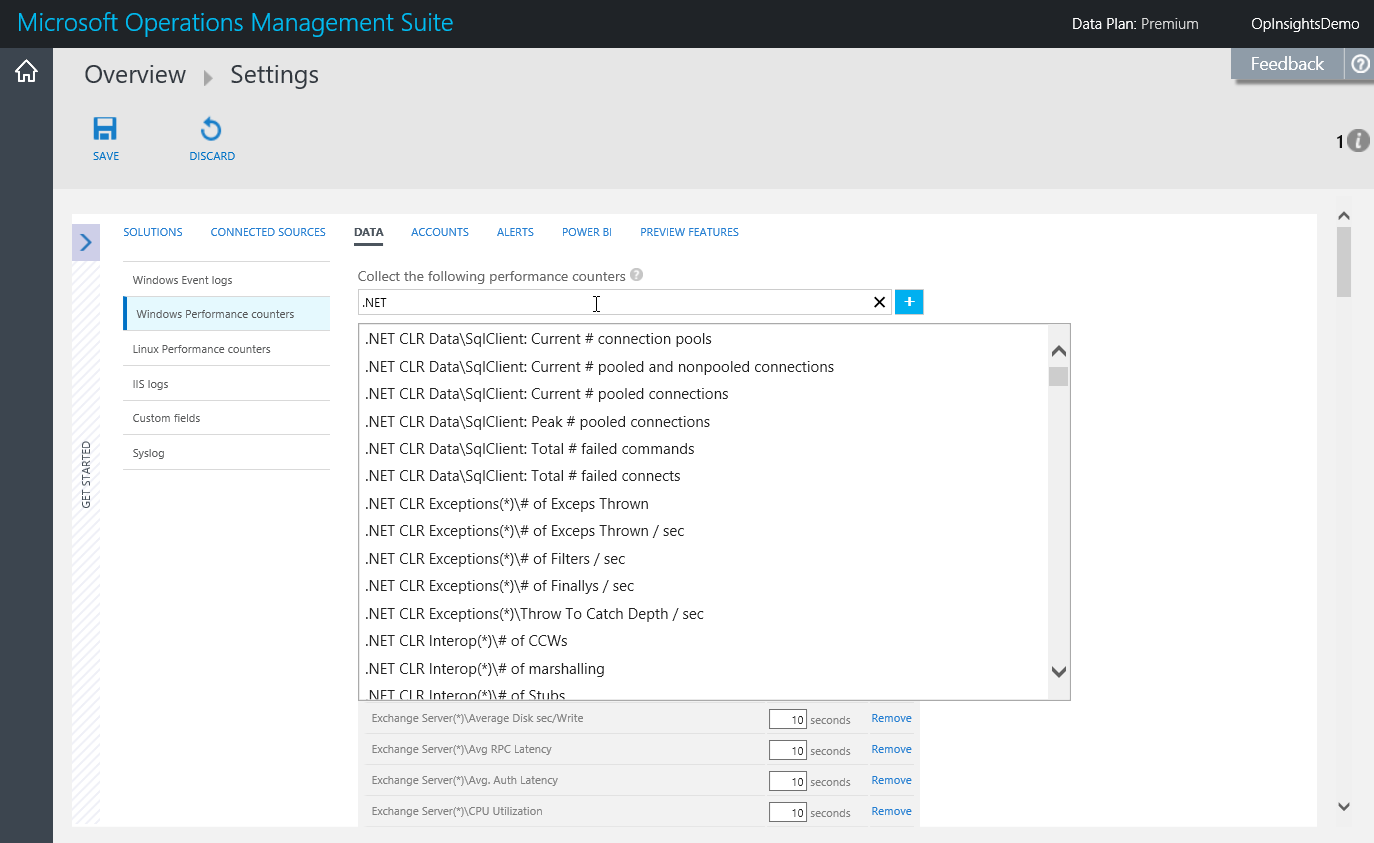
The easiest way to get my performance counters into OMS now is to type a partial object name, and then make a selection via the drop-down list that appears:
However, if I make a mistake, it is easy to select Discard at the top of the screen under Settings, and then start over. This option only appears when there are changes pending.

That is all I have for you today. Join me tomorrow when I’ll talk about other aspects of near real-time performance data collection.
I invite you to follow me on Twitter and the Microsoft OMS Facebook site. If you want to learn more about Windows PowerShell, visit the Hey, Scripting Guy! Blog. If you have any questions, send email to me at scripter@microsoft.com. I wish you a wonderful day, and I’ll see you tomorrow.
Ed Wilson
Microsoft Operations Management Team